


Inflation Has Peaked; Now We Watch for a Shock Cluster
Updated 7-13-2022
Lede
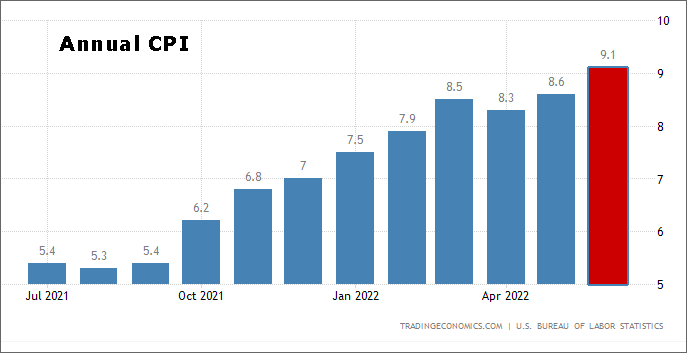
Update: 7-13-2022• Annual CPI rose to 9.1% in June of 2022, the highest since November of 1981, from 8.6% in May and above market forecasts of 8.8%. Headline CPI has not only cooled down, it accelerated. Here is the one-year trend:
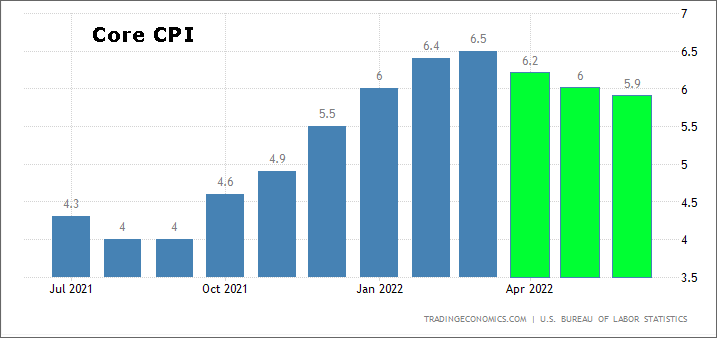
• Core CPI which excludes food and energy increased 5.9%, slightly below 6% in May, but above forecasts of 5.7%. While Core CPI came in above forecasts, it has maintained a three-month trajectory of a disinflationary trend. Here is the one-year trend:
The drivers of headline CPI were the following:
• Energy prices rose 41.6%.
• Gasoline prices rose 59.9%.
• Fuel oil prices rose 98.5%.
• Natural gas prices rose 38.4%.
• Food prices rose 10.4%.
• Airline fares rose 34.1%.
Now we look to the recent past for a signal of the future, because most of the items listed above and mnay others have already fallen.
As we shared on the recent CML Pro webinar, we believe that inflation has peaked, although it may not show in headline numbers, we do believe it will continue to show through in core measures.
There will be many charts to follow, but we start with a pair; a chart of core PCE from the FRED and then directly below it the year-over-year change in average hourly earnings of all employees (total private) from TradingEconomics.com:
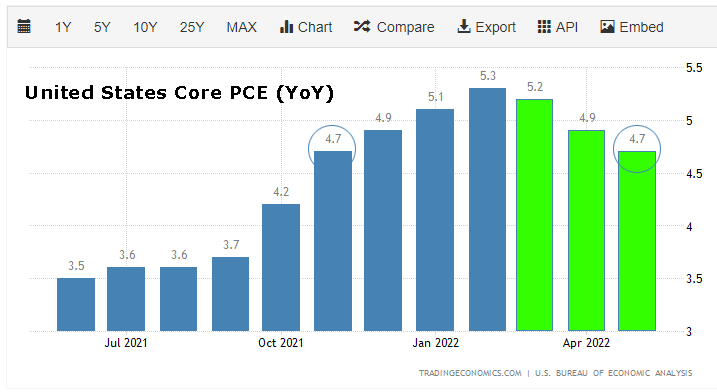

We note both the elevated levels and the dipping trajectory of both datasets. We can add Core CPI (from above) to that group.
Now we review much more data, analyses, and conclusions.
Preface
In 2021 we wrote this: inflation is the “only” thing that matters. The "only" in quotation comes from the reality that we can't simply disregard all idiosyncratic risk, but the point is made by the statement.
We still feel that way so this is going to be a discussion in large part about inflation.
Like the webinar, we reprise our goals.
• Introduce facts, like A, B, and C
• From those facts we do an analysis A, B, and C. This analysis is not fact; one can agree or disagree
• From that analysis A, B, and C we make final conclusions (these can also be called opinions)
The nice thing about the A, B, C exercise is that an investor can choose to disagree with the analysis and conclusion, while at least gaining value from the process.
Intellectual adults make their own decisions, and we write for intellectual adults. Consider your own analysis and conclusions.
Story
We first note that a large part of excess inflation is due to excess supply driven inflation. 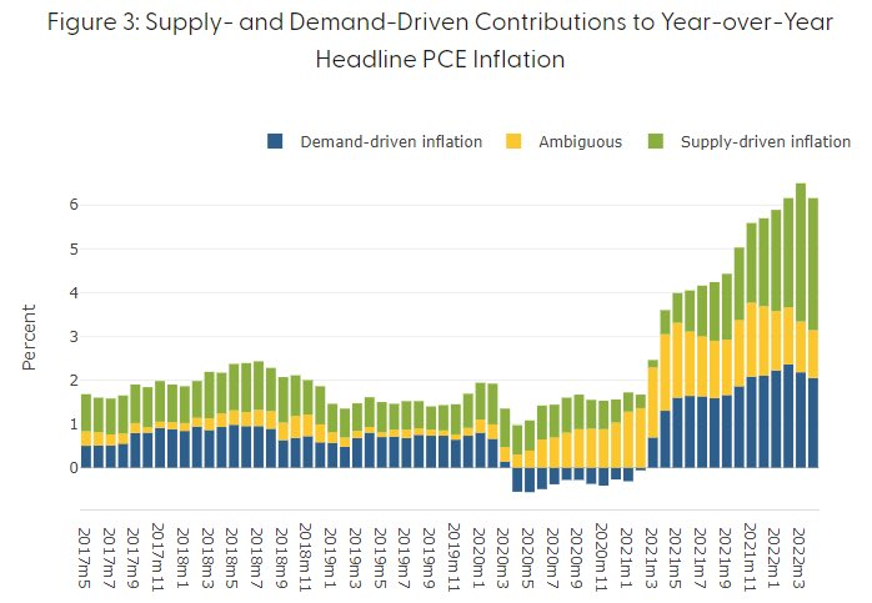
There is excess demand-side inflation that the Fed can address but most of the inflation the Fed cannot address (supply-side and energy).
Now we turn to the deflationary movements in several areas with a focus on commodity prices, trucking prices, shipping prices, logistics generally, rent prices, housing prices, finally job numbers, and finally wage inflation.
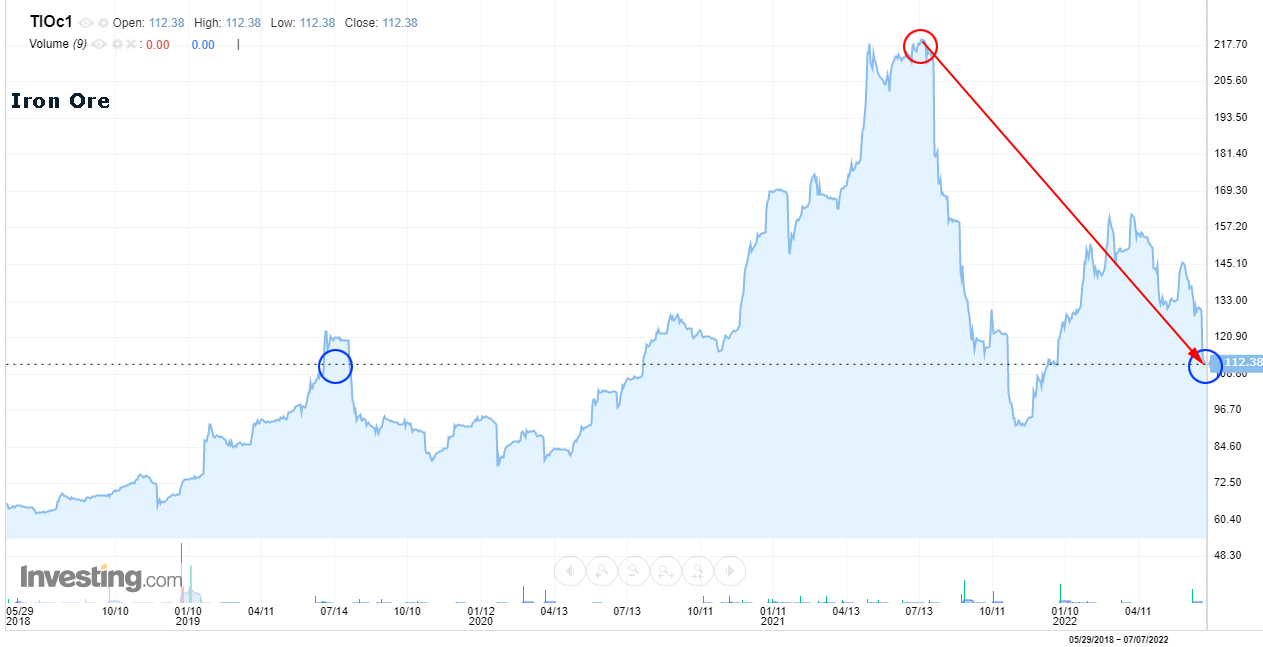
-- Commodity Prices
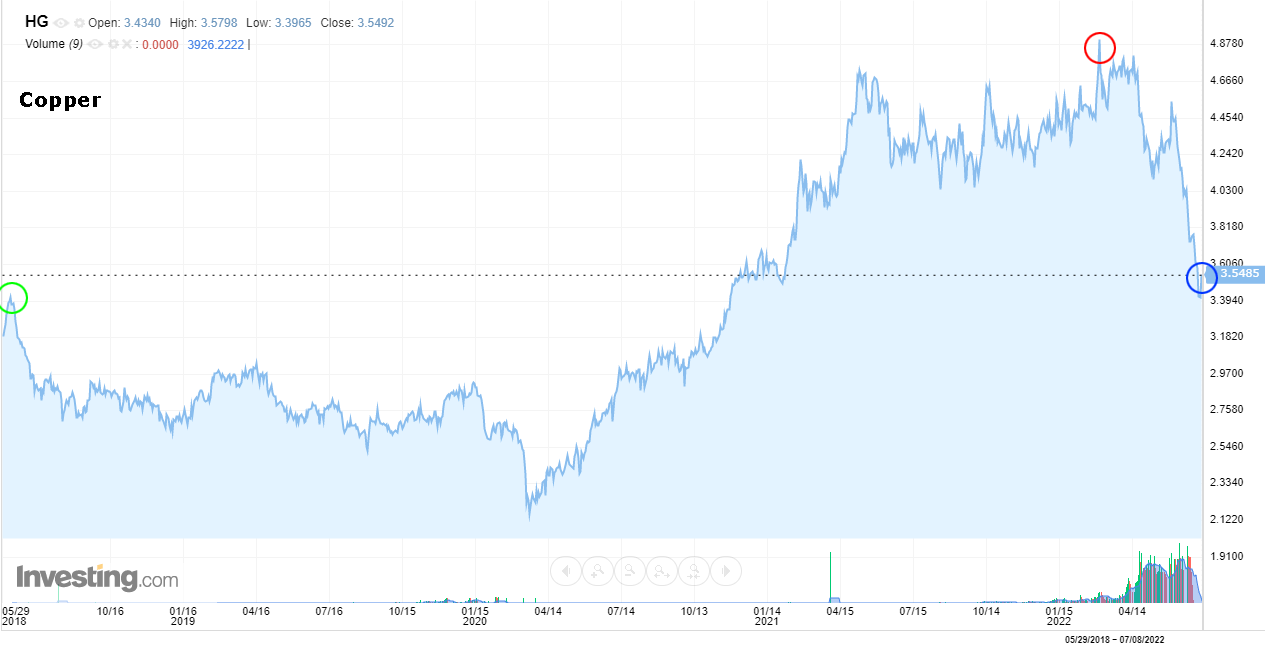
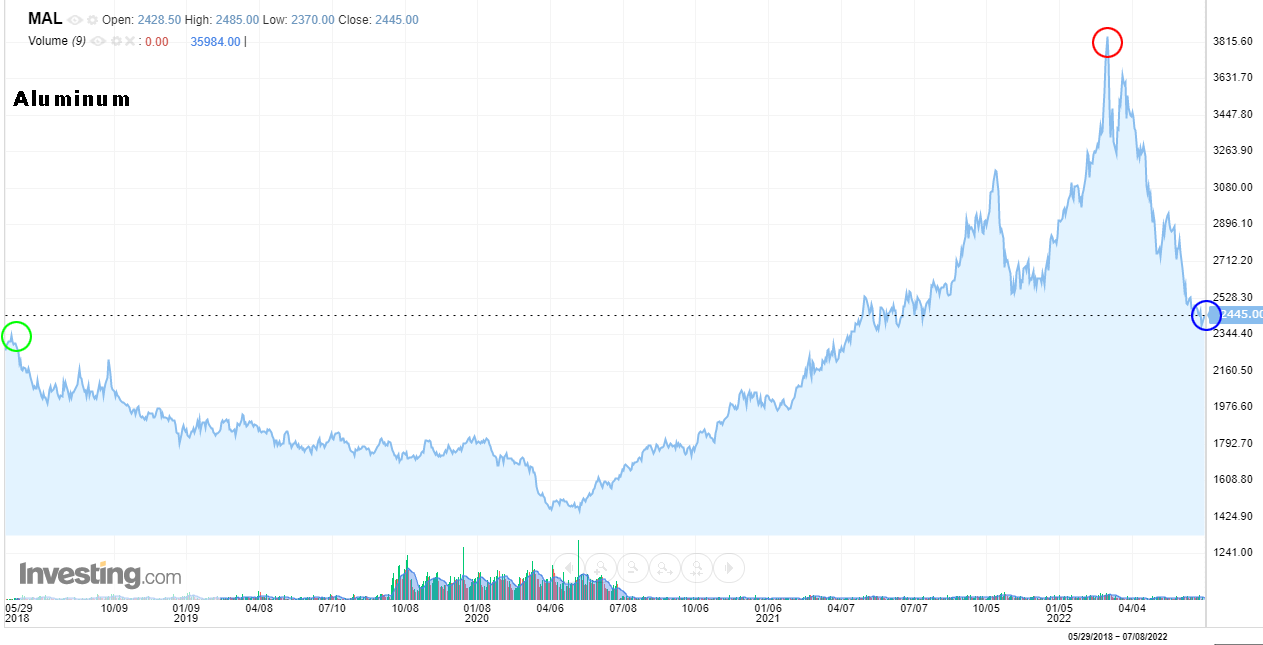
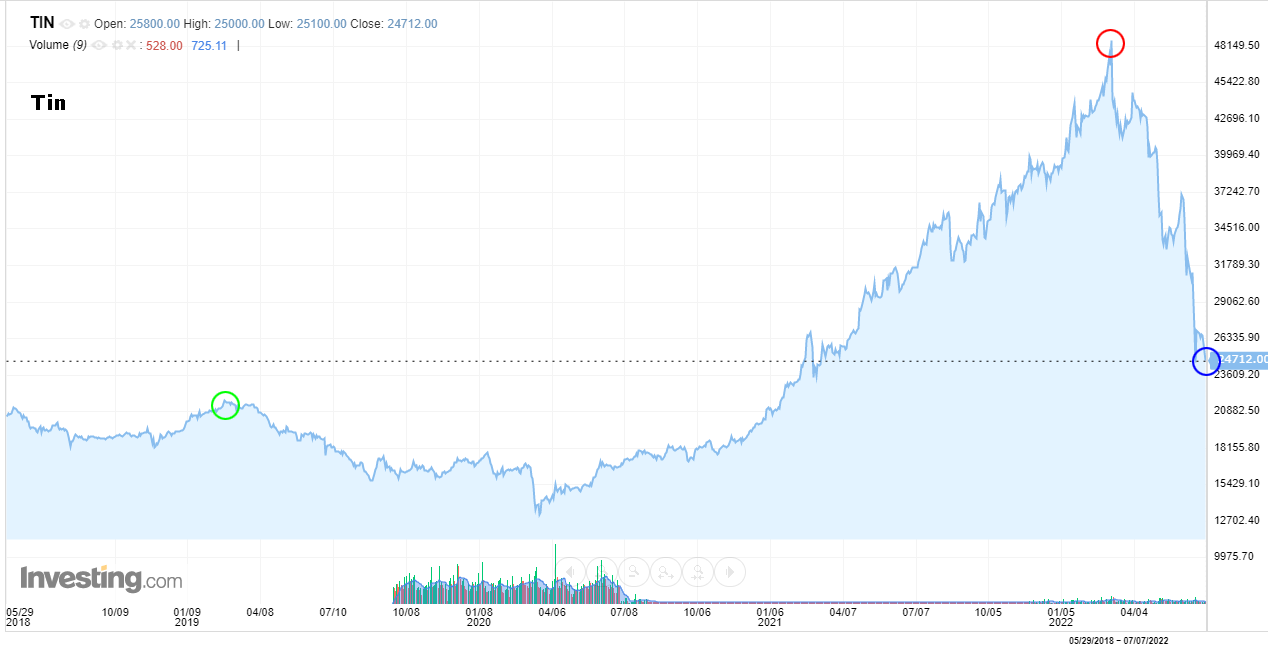
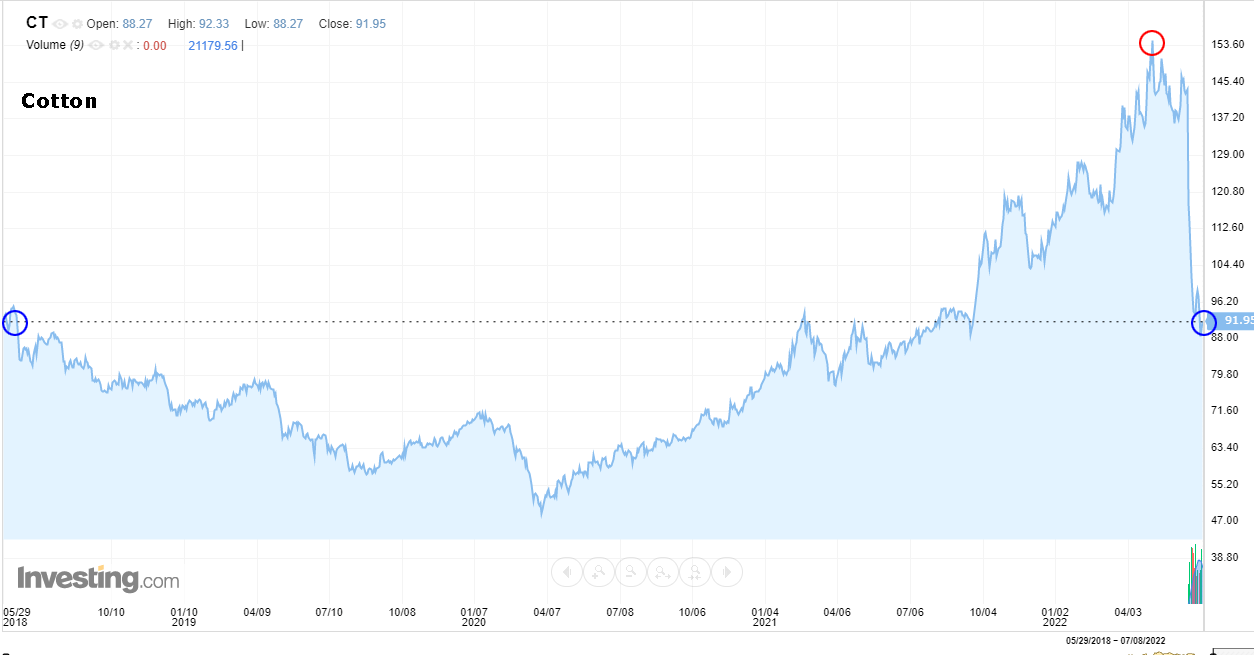
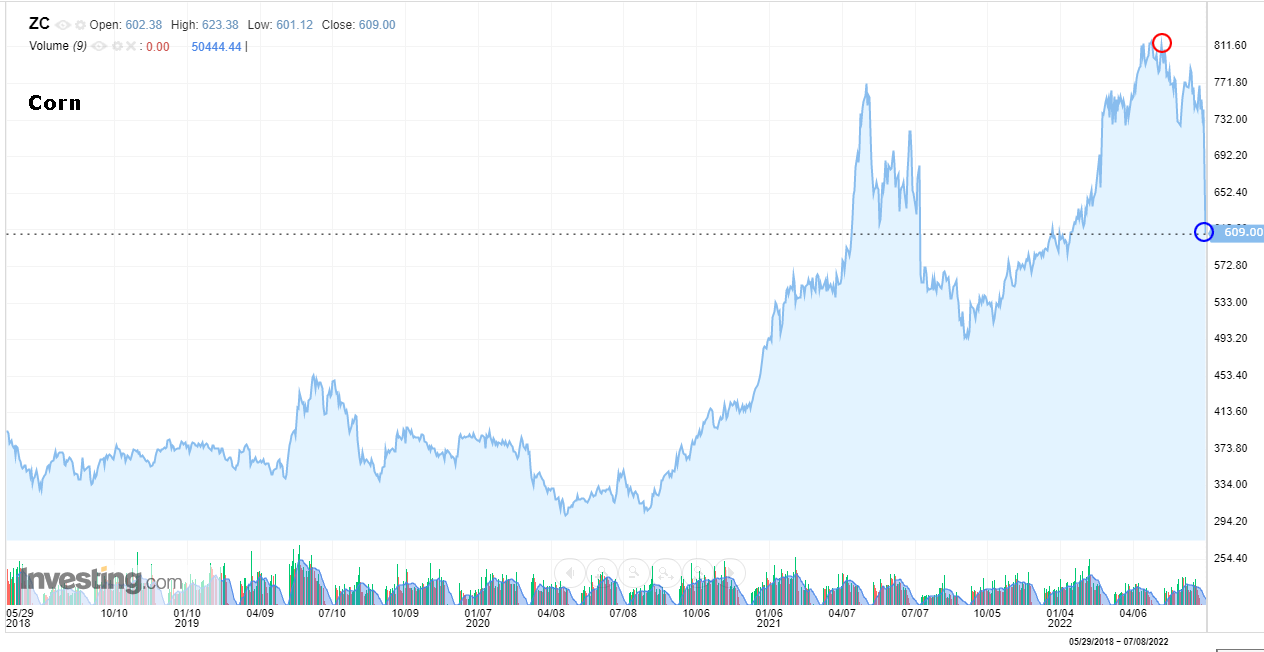
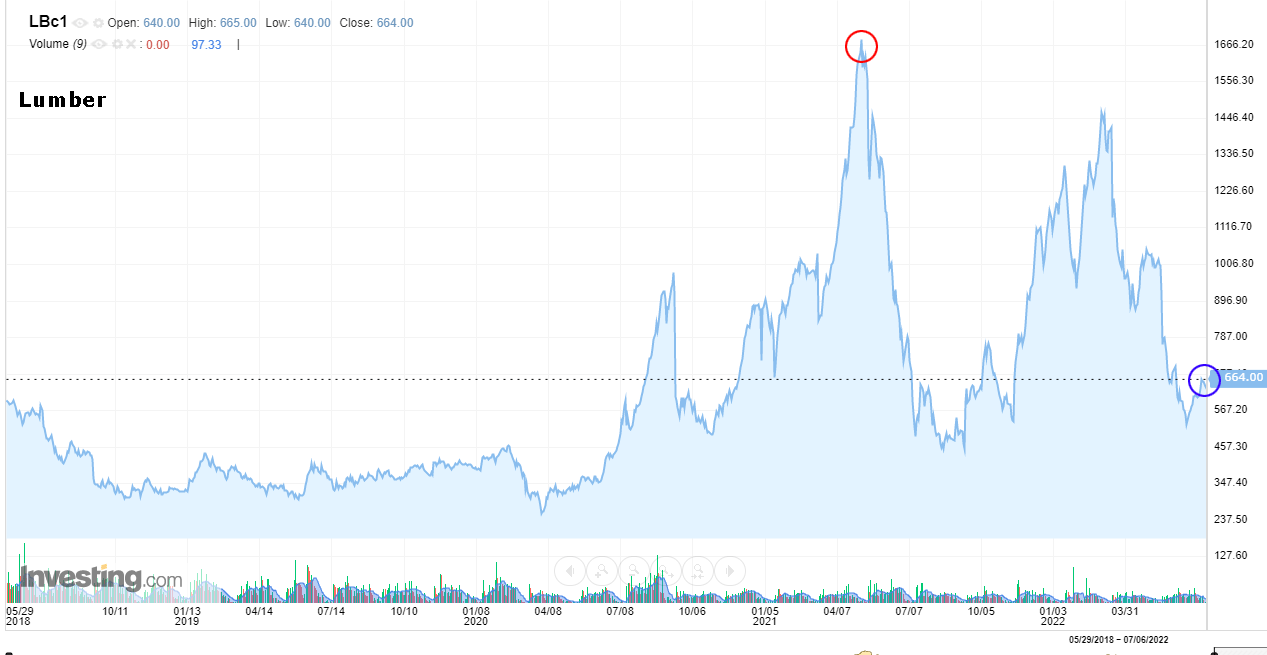
The prices of Iron Ore, Copper, Aluminum, Tin, Cotton, Corn, Lumber, Wheat, and Fertilizer have all seen substantial deflation.
Iron Ore prices have fallen nearly 50% from their highs in July 2021 and have fallen 25% since the start of June.
Copper prices have fallen nearly 30% from their highs in March 2022 and have fallen 20% since the start of June.
Aluminum prices have fallen 35% from their highs in March 2022 and have fallen 25% since the start of June.
Tin prices have fallen 50% from their highs in March 2022 and have fallen 23% since the start of June.
Cotton prices have fallen 40% from their highs in May 2022, with nearly all of that since a peak in early June.
Corn prices have fallen 25% from their highs in May 2022, with most of that since a peak in early June.
Lumber prices have fallen 60% from their highs in May 2021, 55% from the highs in March 2022, and modestly risen since the start of June.
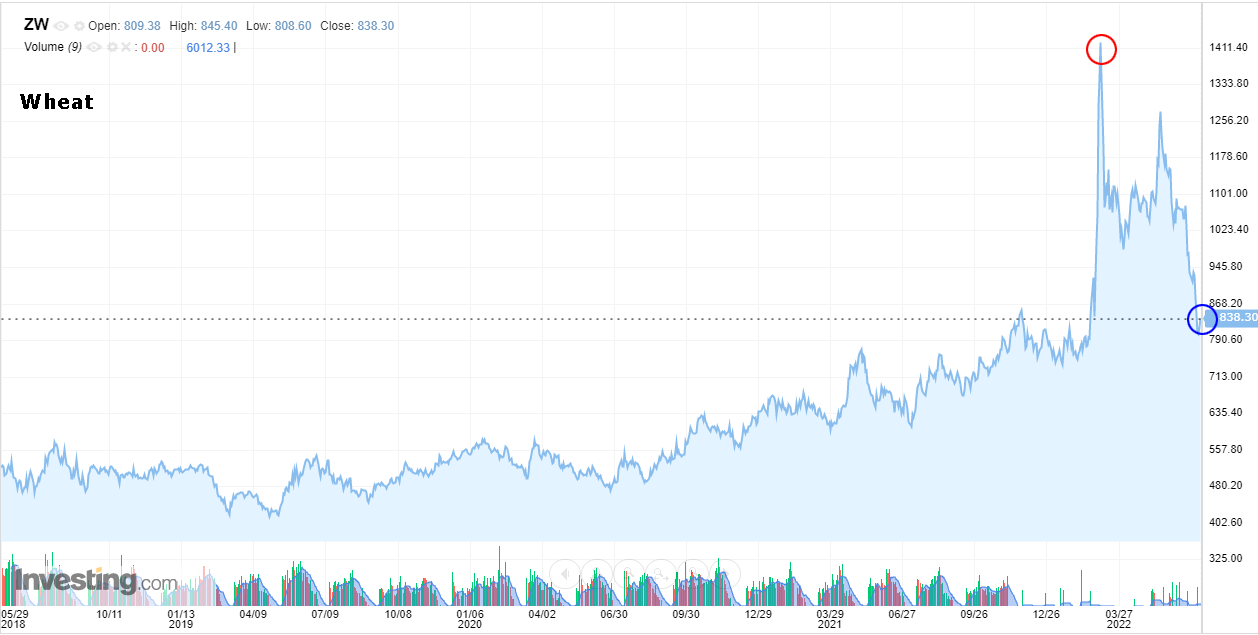
Wheat prices have fallen 40% from their highs in March 2022 and have fallen 23% since the start of June.
Fertilizer prices have fallen 30% from their highs in April 2022 and are roughly unchanged since the start of June.
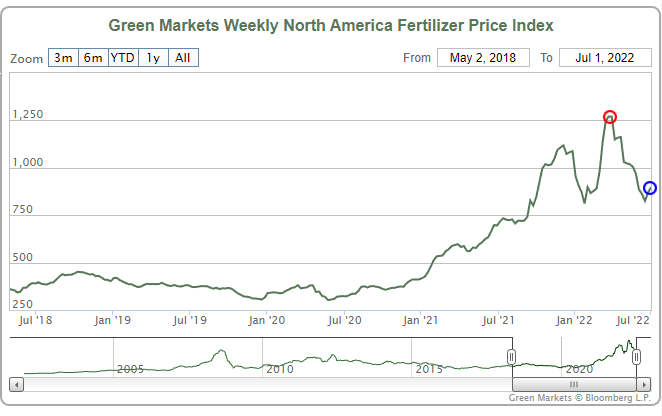
(The Green Markets Weekly North America Fertilizer Price Index is constructed using the fertilizer benchmark prices of US Gulf Coast Urea, US Cornbelt Potash and NOLA Barge DAP.)
-- Logistics and Transportation
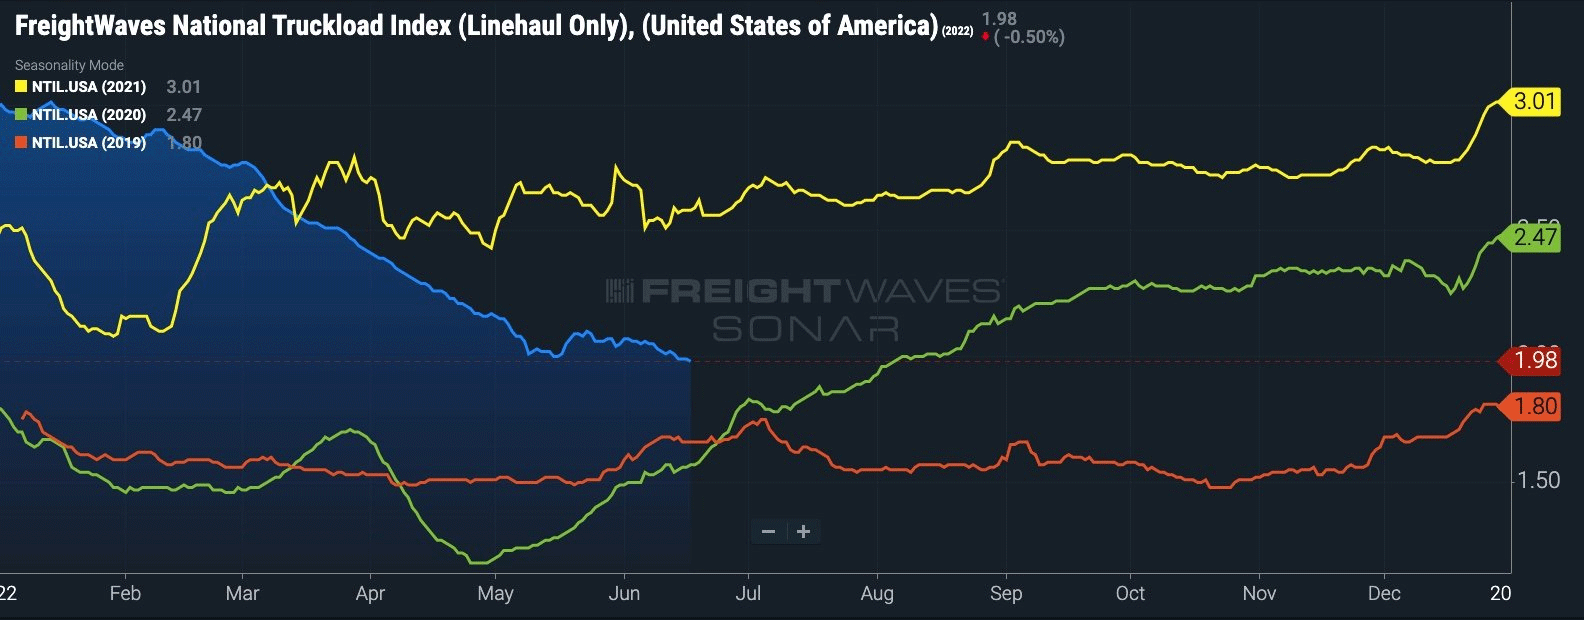
Now we can turn to logistics, and start with trucking costs.
FreightWaves National Truckload Index has fallen 35% since the start of 2022, are below 2021 prices, and possibly on their way to dipping below both 2020 and 2019 prices.
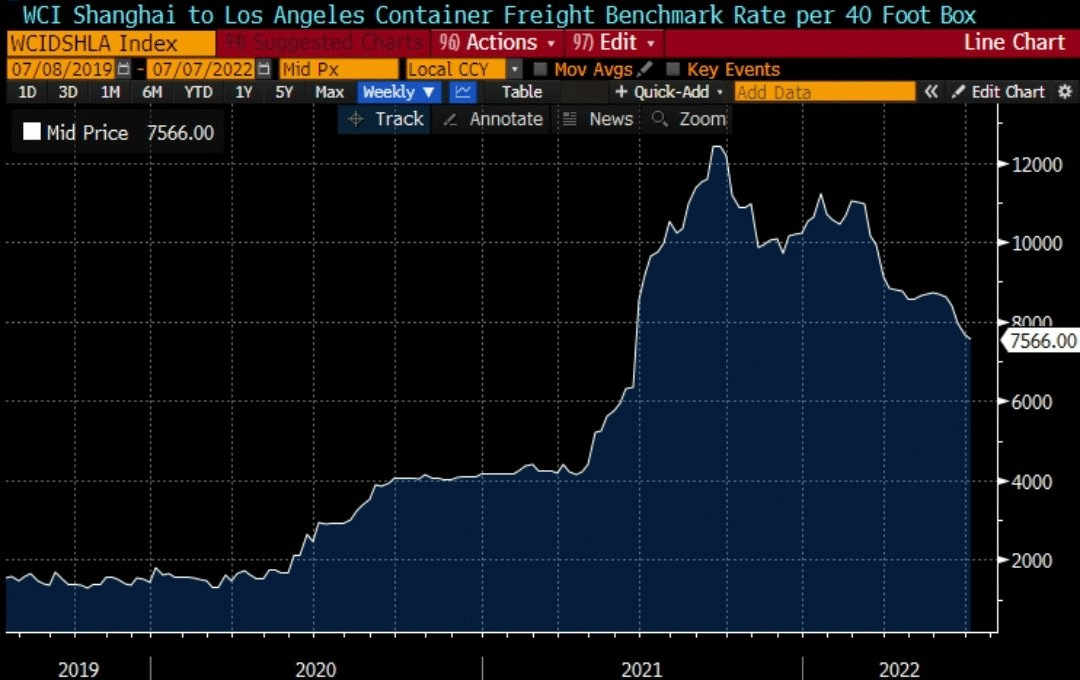
We turn to shipping costs. Shipping from Shanghai to Los Angeles has dropped 40% since peaking in mid 2021, and are down over 15% since the start of 2022.
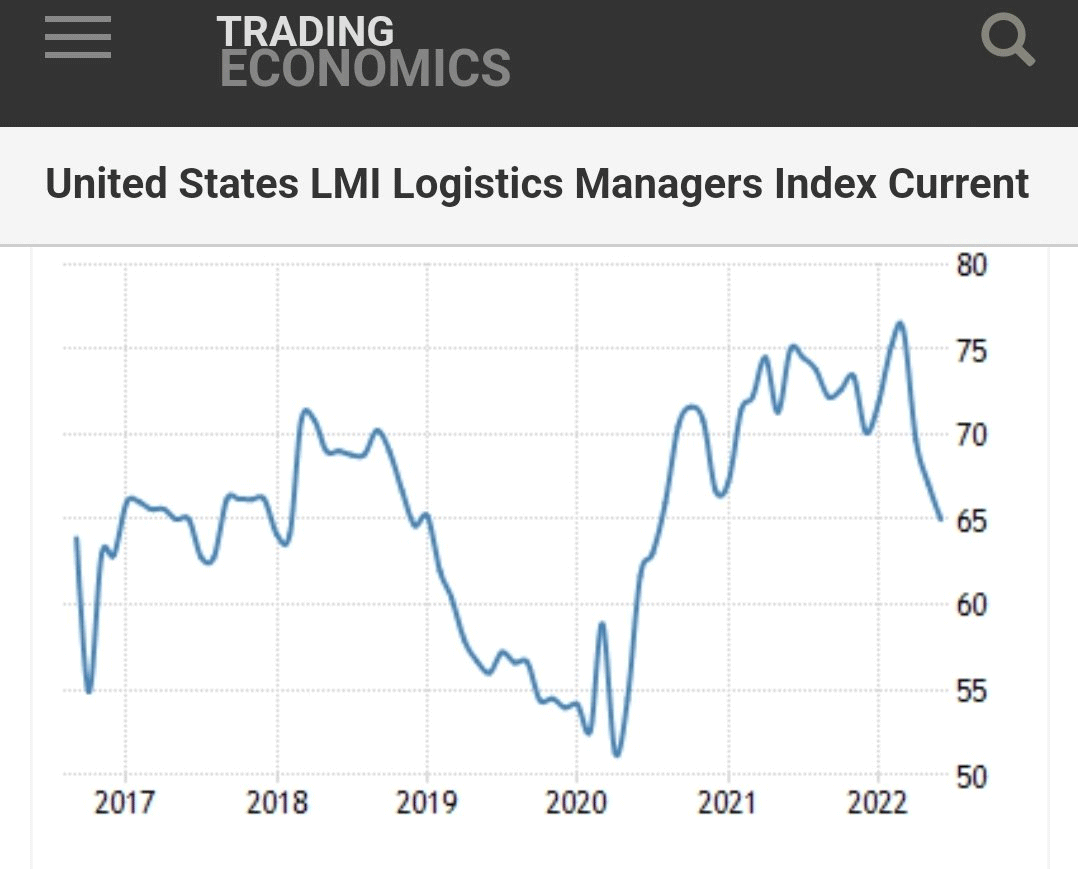
Next we can turn to logistics as a whole, namely the The Logistics Manager’s Index (LMI) in the US.
The most recent data is for June 2022, and LMI extended the decline for a third month in a row to a two-year low of 65 in June of 2022 from 67.1 in May, staying below the long-term average of 65.3 for the first time since July 2020.
Next we can turn to rent costs.
-- Rent Prices
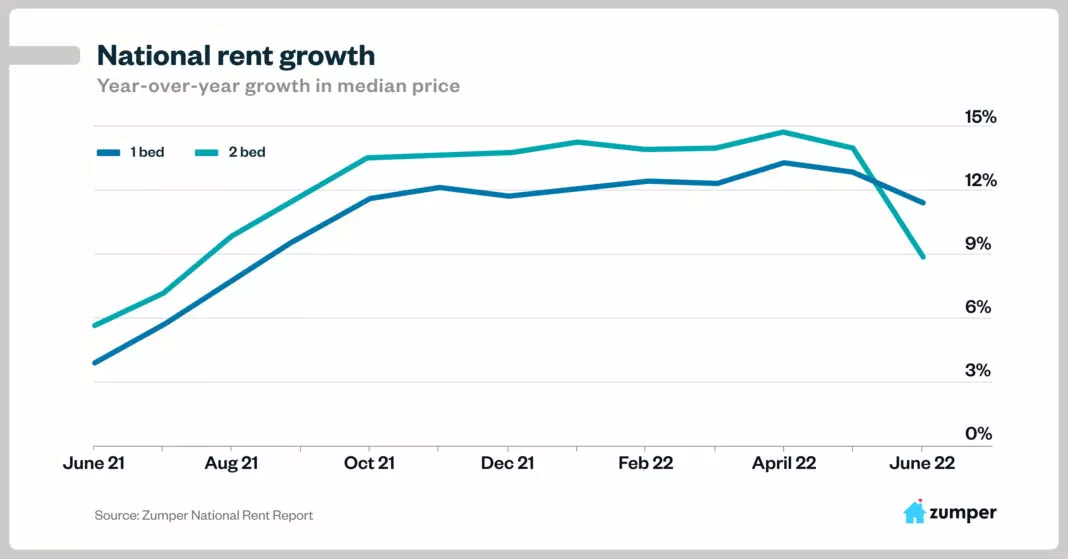
We use the Zumper National Rent Report to examine rent prices.
Rent is still seeing substantial inflation, but there is now evidence of slowing inflation (disinflation).
The report reads the following:
• Zumper’s National Index signals a long-awaited slowdown in the shocking price hikes over the last year. Median one-bedroom rent is up 0.5 percent over last month–yet another all-time high, but also a much more reasonable growth rate than the one to two percentage point increases that became the norm during the height of the pandemic.
• Meanwhile, two-bedroom rent is down a significant 2.9 percent over last month–a signal that some consumers who’d put off buying a home are finally making the jump as housing prices begin to level off.
Next we turn to the housing market.
-- Home Prices
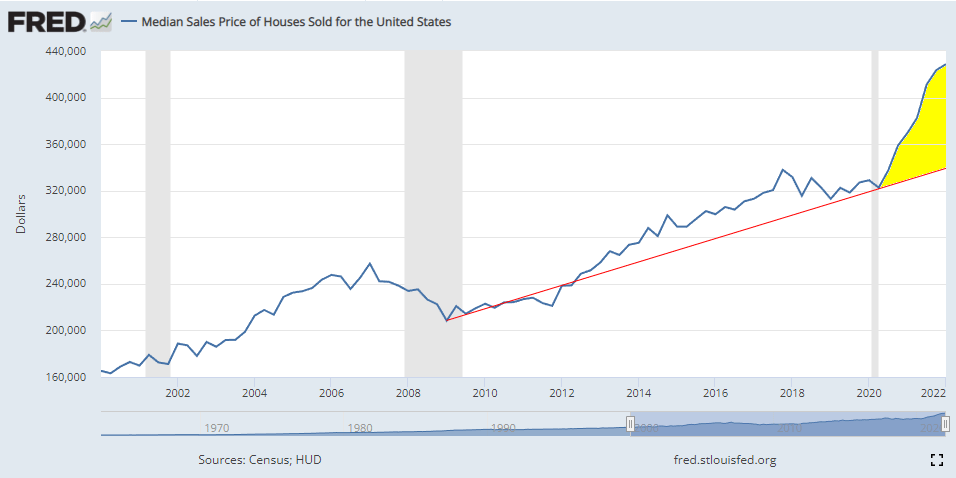
It's been well reported that U.S. home prices have been exploding higher to all-time highs.
Here is a chart of the median home price in the U.S. from the Federal Reserve where we draw in the linear trend starting in 2008 through today and then shade the excess price inflation from that trend:
But finally, there is evidence of disinflation (less inflation, not dropping prices), and we can see that in numerous areas. First, a glance at the year-over-year change from the chart above shows a clear deceleration of price inflation.
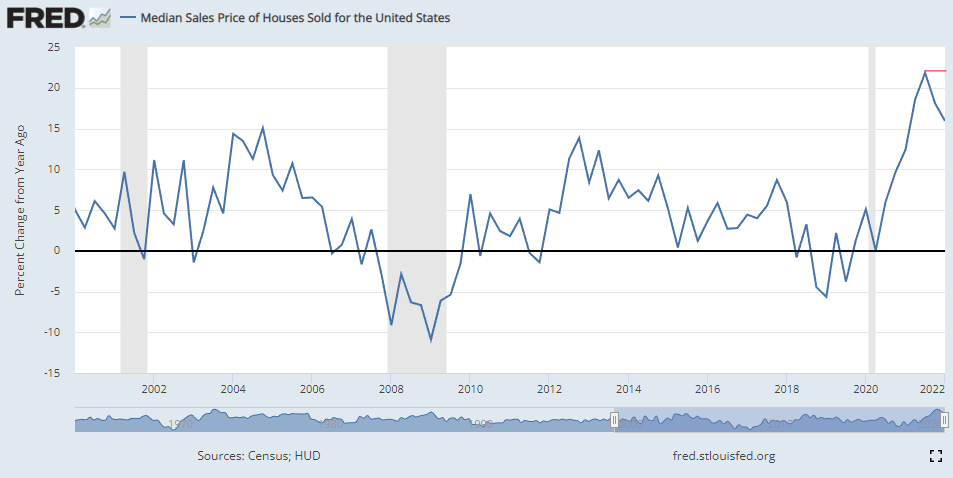
Price increases are still excessive, but the rate of change (inflation) has slowed.
There is also circumstantial evidence of the slowing housing market.
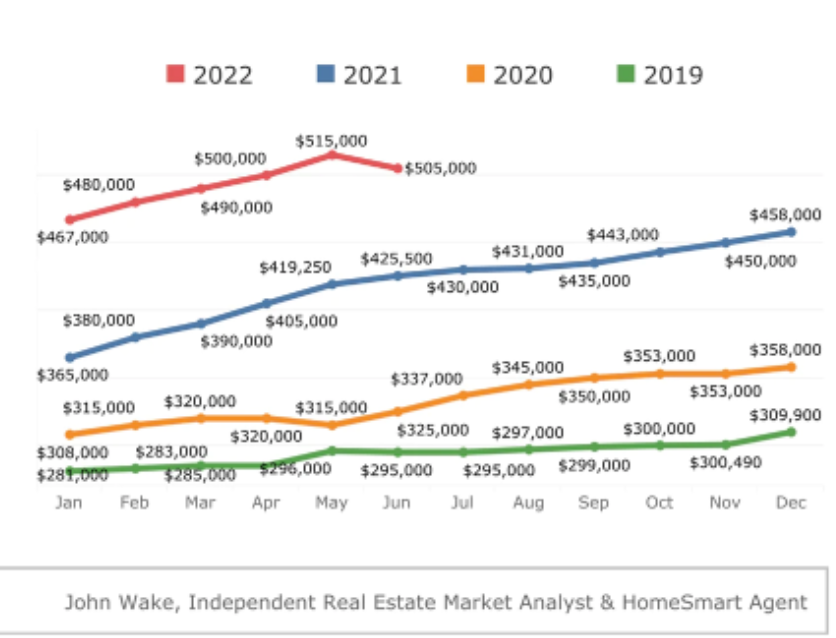
The second hottest U.S. market has been Phoenix, and for the first time in more than a year, prices dropped month over month (by 2%):
Further,Weekly Quick move-in (QMI) inventory for Phoenix has risen more than 10-fold from its lows earlier in 2022.
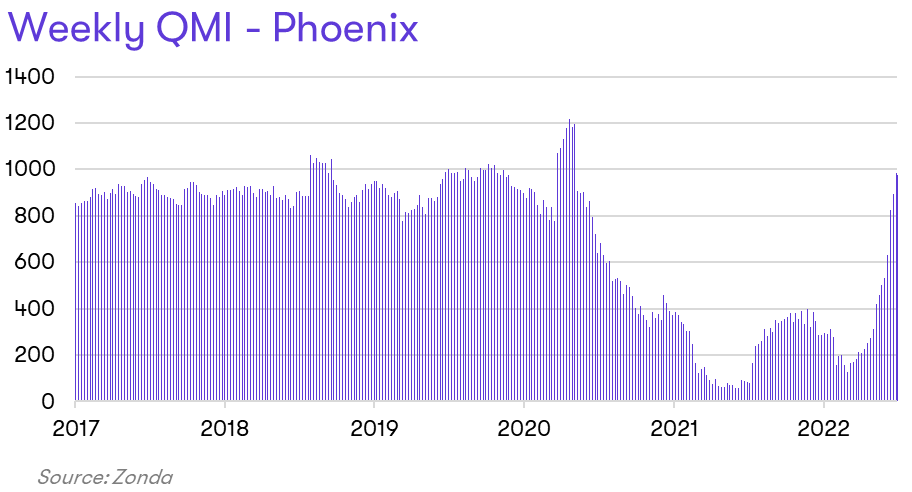
(A "Quick Move-In Home" (QMI) also referred to as a "spec home" is a home that a builder has completed, or nearly completed, and can be bought and occupied within weeks.)
There is similar circumstantial evidence of disinflationary trend around the nation:
• 5-27-2022: Home sellers are lowering their prices at the fastest clip since 2019.
• 6-27-2022: U.S. existing-home sales fall for fourth straight month in May as prices skyrocket
• 6-30-2022: Housing shortage starts easing as listings surge in June.
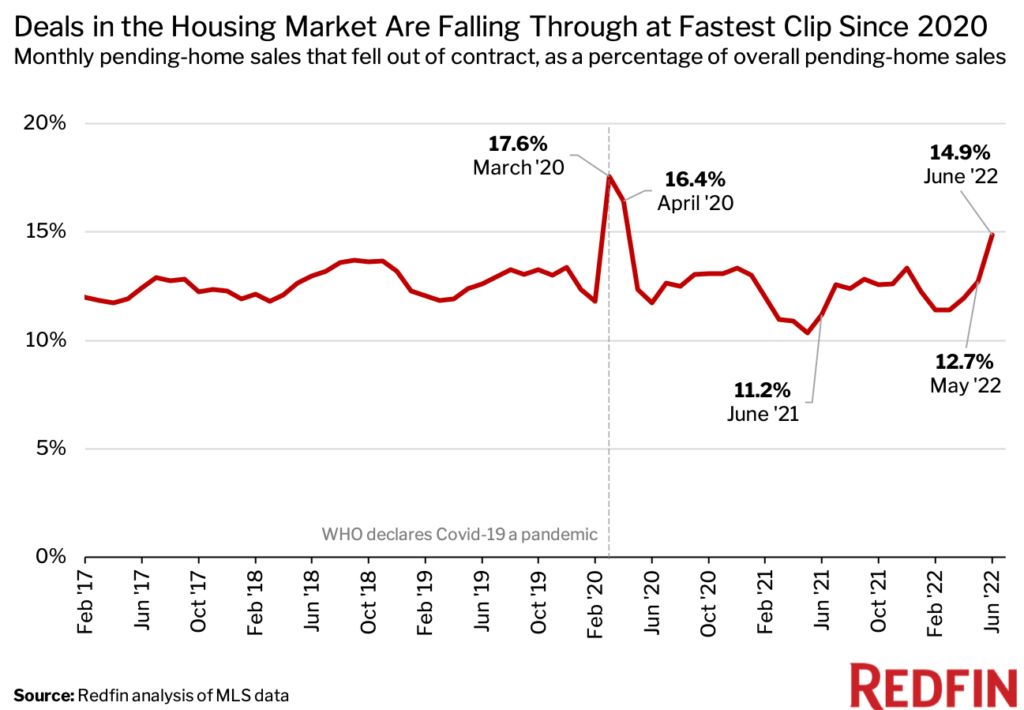
And on 7-11-2022, Redfin published an article entitled "The Deal Is Off: Home Sales Are Getting Canceled at the Highest Rate Since the Start of the Pandemic."
From that we learned this:
That post also included the follwoing chart:
In total, there is noth empirical and circumstantial evidence that home price inflation is cooling and may have peaked.
Next, we can turn to the white hot job market and wage inflation.
-- Wages and Jobs
United States Wages and Salaries Growth, like rent, still remains in an high inflationary period, but the growth rate is cooling.
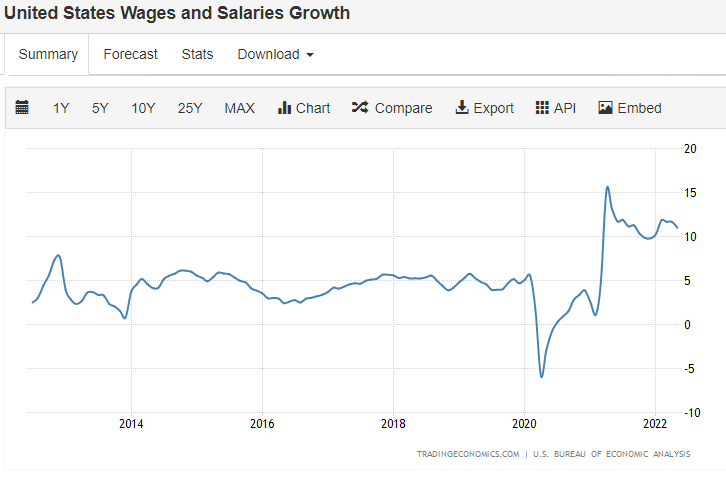
But the most recent data in the chart above is from May. There is reason to believe that the start to the disinflation trend may continue.
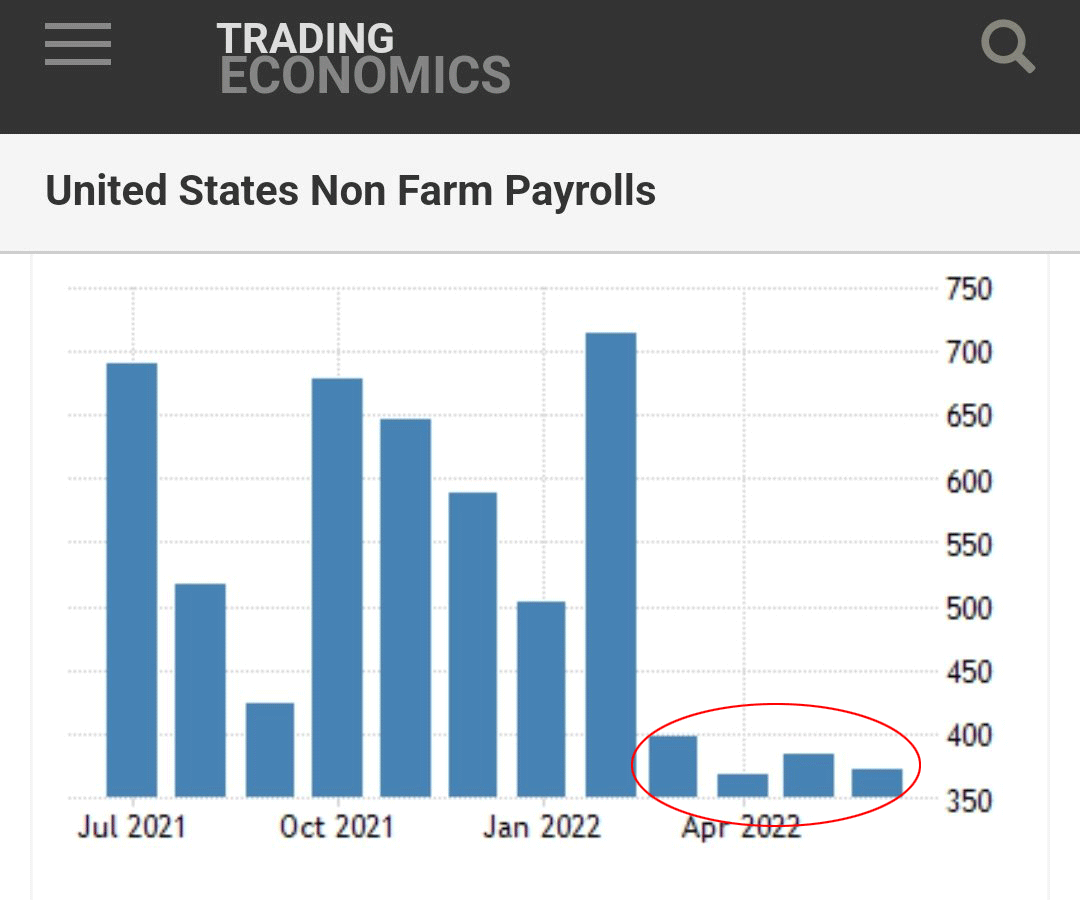
On 7-8-2022, we got the United States Non Farm Payrolls report with updated data.
The American economy added 372K payrolls in June of 2022, much better than market forecasts of 268K and only slightly below a downwardly revised 384K in May.
While the job market came in much stronger than forecast, the monthly gains appear to have normalized at a lower level:
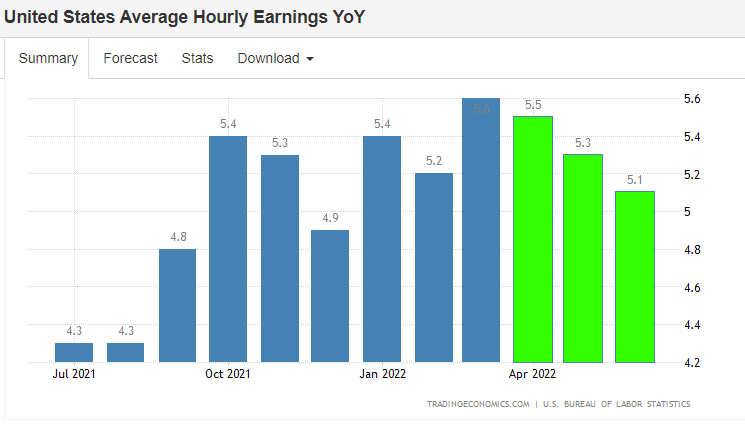
With respect to wages, average hourly earnings YoY in the United States decreased to 5.1% in June from 5.3% in May of 2022, although higher than the 5.0% estimate.
Wage inflation remains high, but a slight disinflationary trend does appear to have begun:
There is data that became available on 7-7-2022 with respect to jobs, and that comes in the form of the United States Challenger Job Cuts measure.
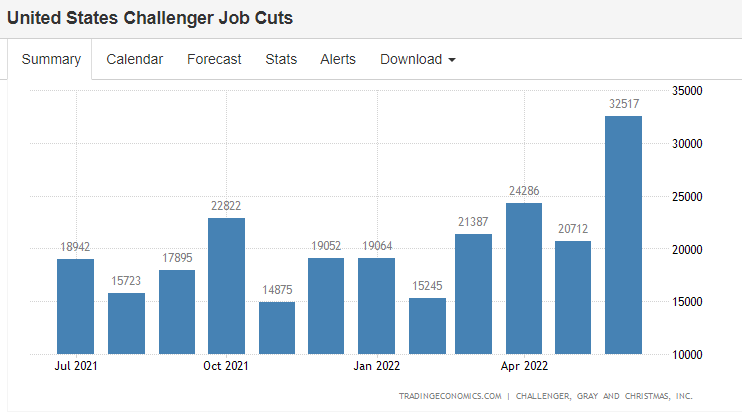
The report reads the following:
• US-based companies announced plans to cut 32,517 jobs from their payrolls in June of 2022, the highest reading since February last year, and a 58.8% increase from the 20,476 cuts announced in the same month last year.
• The report showed that hiring announcements turned negative in June (year over year).
Here is that chart:
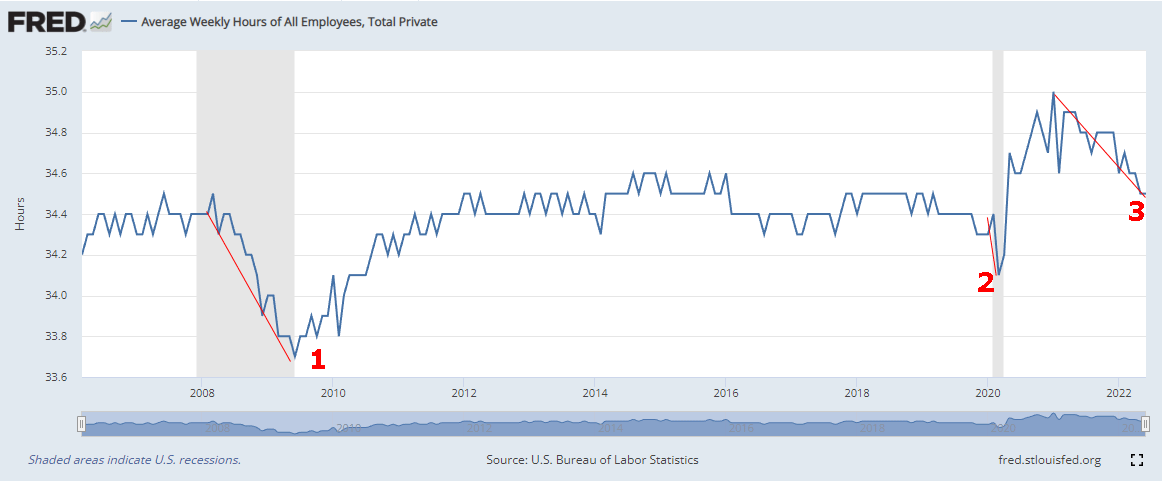
We also learned that the US average workweek hours decreased to 34.5 (@MacroAlf).
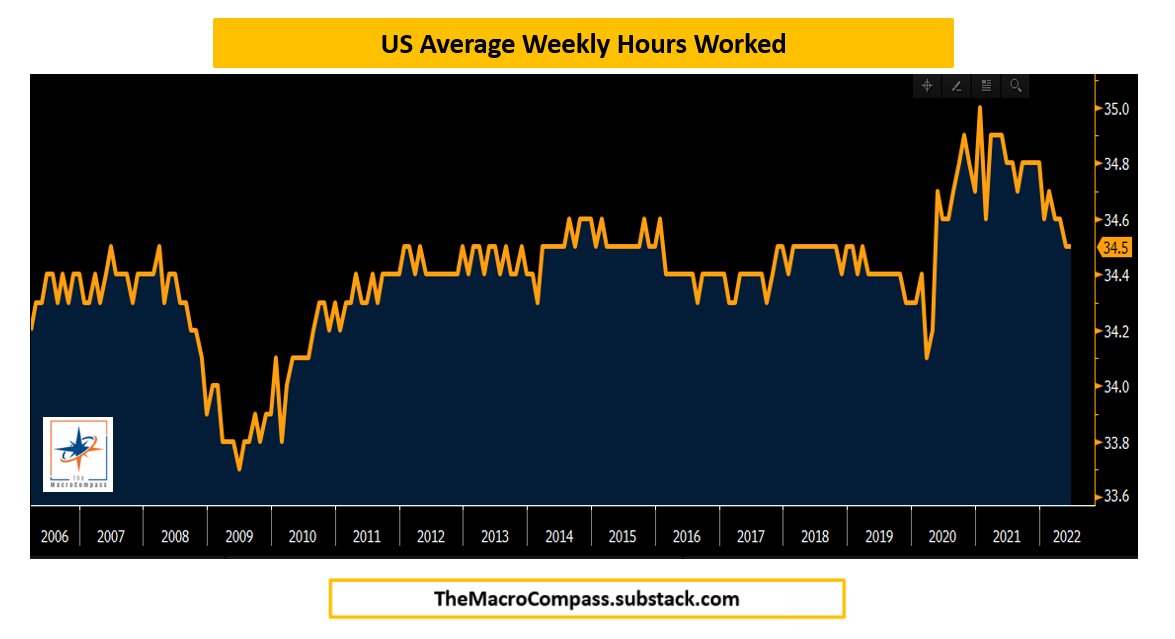
The Federal Reserve shares this data going back to April 2006, and in the span of this data, we can see that dropping average weekly hours worked has occurred in slowing economic times:
Next we look at the year over year change in the number of job postings on indeed:
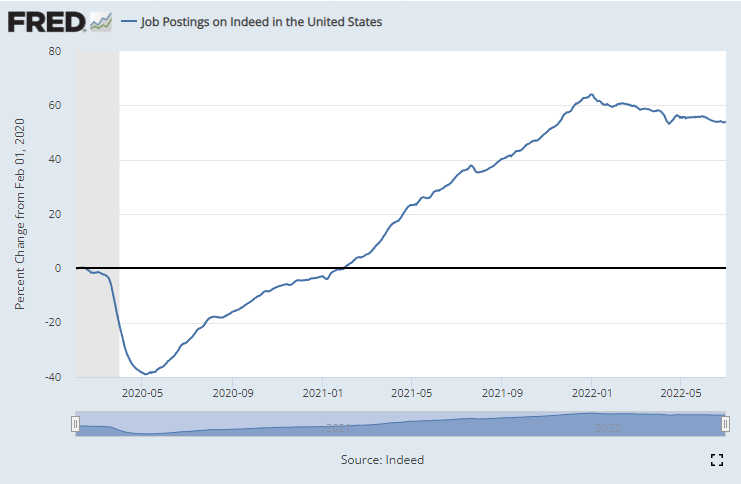
There's a rather clear, but slow drop in the growth of job postings.
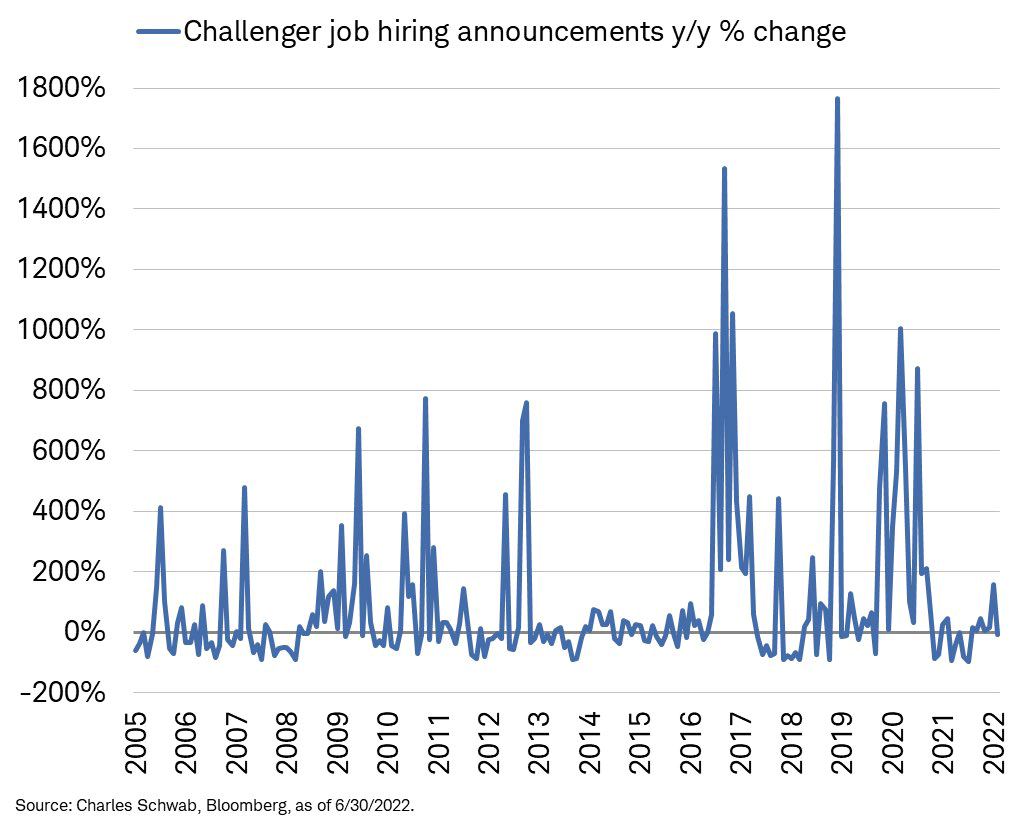
Just as job postings are slowing, job cuts are accelerating. In a report from Charles Schwab, we get this set of charts which illustrate the Challenger measure of job-cut announcements since 2007 (left) and a focus on the last year (right).

While the most recent jobs report may not show it in headline numbers, the job market is weakening.
Finally, the JOLTS (Job Openings and Labor Turnover Survey) reports drove headlines as well: Job openings totaled 11.25 million for May, a considerable drop from the upwardly revised 11.68 million in April, according to the Labor Department's JOLTS report.
All told, there is circumstantial evidence of a cooling job market, and it may also be coming the way of layoffs.
Here is a smattering of those recent headlines:
• 5-16-2022: Tech layoffs loom as more companies announce big cuts to their workforces
• 6-3-2022: This is not (just) another roundup of tech layoffs
• 6-14-2022: Tech layoffs accelerate in June, with more than 7,000 losing their jobs so far
• 6-14-2022: A wave of layoffs is sweeping the US
• 7-7-2022: Jobless claims edge up to highest since January; planned layoffs soar;
But a cluster shock may be next
On 7-8-2022 we got news that Japan's former Prime Minister, Shinzo Abe, was assassinated, and on 7-7-2022 we got news that Boris Johnson resigned as U.K. prime minister "following an avalanche of resignations by members of his party that eroded his authority and paralyzed the British government."
Keep just the last two days’ worth of news at the forefront of your mind as we head into this next section of the dossier.
While there is evidence of both deflation and disinflation, the risks to a break in the system at large may be increasing.
We would classify the next several months as extremely elevated risk.
We covered this in the webinar, and do so again.
We don't usually think about it but we should now. The characteristics of a random process matter and why one bad kind may be here.
Let's have a chat about why it's relevant to the current macro environment, inflation, and more.
Off we go...
Jargon: A random process is formally called a "stochastic" process.
A singularly stochastic process has just one underlying driver.
These are the kind we are used to:
coin flip, roll of dice.
Flip a coin once an hour for 100 days.
We'll call heads a success.
Every day you'll get 24 results (one flip an hour) which on average will lead to 12 successes (heads).
Easy enough.
It doesn't matter what the last result was, the next one will always have a 50% chance of success.
This is called path independence.
The sum of these could formally be called a Poisson process. It's singularly stochastic.
This is easy.
But that's not how all things in nature are best described (modeled).
Take earthquakes, for example.
One on the one hand there is some underlying Poisson Process that drives it.
Let's say there is a 1/100 chance an earthquake happens on any given day.
But earthquakes cluster... 🤔
Whatever the odds of an earthquake happening (say once every 100 days), those odds immediately rise following a prior earthquake.
So, there must be a second stochastic process behind it, beyond the 1/100 days process.
And if that's true, then it's not like a coin flip, because it's path dependent.
When an event itself occurring increases the odds that it happens again, we call it self-exciting.
In this case, an earthquake increases the likelihood of another earthquake causing clusters.
This self-exciting doubly stochastic process is called a Hawkes process.
But we're not here to talk about earthquakes...
Self-excitement happens in markets a lot and it has a special name too - contagion.
So, a credit default of one firm in an industry increases the likelihood of another default in the industry and on, and on, causing a credit contagion.
We've also seen this with counter party risk in hedge funds, like LTCM.
But there is a far more sinister version of doubly stochastic processes with self-excitement, and this is where I was leading us...
When we got our health shock, COVID, we got a cluster of other shocks, each causing the next:
monetary shock, fiscal shock, asset shock (up), supply chain shock, food shock, inflation shock, asset shock (down)...
... we then got a geopolitical shock - Russia invading Ukraine.
And now we are here and the greatest risk to the market and the world is not inflation, it's a continuation of shocks.
That could be China invading Taiwan, but we don't know.
What we do know is that we don't have any buffer or slack in the system to absorb anymore shocks.
There is resiliency in this whole apparatus that connects us, but it can snap.
And it's the risk that this self-exciting doubly stochastic process excites yet another shock...
That is by far the largest risk to the market now and could undue all of the disinflationary trends that have appeared.
Inflation has peaked, normalcy is returning to the supply chain, COVID is controlled, all the right things but none of it will hold up under another shock.
We need the shock cluster to end.
The good news is that this doubly stochastic process, called a Hawkes process, does have an exponential decay characteristic.
That means the elevated probability of an event occurring after one before it just occurred decays exponentially.
So, what we really need, desperately need, is calm...
...because more calm time yields lower probabilities of more events.
It was this shock cycle that strangled the U.S. in 1970s-80s (inflation, off gold standard, oil embargo, Iranian revolution, Vietnam, etc.).
We need it to stop and risk keeps rising that it won't.
So, what am I hoping for?...
Nothing else.
If we get that, we'll be fine.
History tells us there is a risk we don't get nothing else... but rather we get more.
But history also tells us that eventually the self-exciting process chills out.
The importance of "when?" has rarely been as elevated.
Conclusion
Our conclusions, driven by facts (objective), then analysis (subjective) are the following:
• Inflation has peaked but it may be a slow disinflationary recovery.
• Recession risk is rising.
• The shock cluster phenomenon, specifically due to inflation and the instability it creates, leads to extremely elevated risk.
Thanks for reading, friends.
Moving Forward
CML Pro presents this same practice of facts, analysis, and conclusion but focused on micro rather than macro -- a TopPicks stock list. We do this and in addition we provide one-on-one CEO conversations and an auditor verified track record, because of course it's verified.
Each company in our 'Top Picks’ has been selected as a future crown jewel of technology. Market correction or not, recession or not, the growth in these areas is a near certainty.
The precious few thematic top picks, research dossiers, and alerts are available for a limited time at a 30% discount.
Join Us: Discover the undiscovered companies that will power technology’s future.
Please read the legal disclaimers below and as always, remember, CML Pro does not make recommendations or solicitations for the sale or purchase of any security ever. We are not licensed to do so, and wouldn’t do it even if we were. We share research and provide you the power to be knowledgeable to make your own decisions.
Legal
The information contained on this site is provided for general informational purposes, as a convenience to the readers. The materials are not a substitute for obtaining professional advice from a qualified person, firm or corporation. Consult the appropriate professional advisor for more complete and current information. Capital Market Laboratories (“The Company”) does not engage in rendering any legal or professional services by placing these general informational materials on this website.
The Company specifically disclaims any liability, whether based in contract, tort, strict liability or otherwise, for any direct, indirect, incidental, consequential, or special damages arising out of or in any way connected with access to or use of the site, even if I have been advised of the possibility of such damages, including liability in connection with mistakes or omissions in, or delays in transmission of, information to or from the user, interruptions in telecommunications connections to the site or viruses.
The Company makes no representations or warranties about the accuracy or completeness of the information contained on this website. Any links provided to other server sites are offered as a matter of convenience and in no way are meant to imply that The Company endorses, sponsors, promotes or is affiliated with the owners of or participants in those sites, or endorse any information contained on those sites, unless expressly stated.