


Inflation in several key areas is cooling -- yes it is

Lede
As of this date, several green shoots are showing that inflationary trends are cooling, using objective data driven observations.Other data supports the belief that yet more disinflationary trends could be on the way.
It's not good, but it's less bad.
The GFC required a bazooka of Fed action, measured in trillions and required a long lasting monetary easing paradigm to ultimately stave off a depression. That was lesson one.
Lesson two was that such an architecture of monetary policy did not create inflation, irrespective of the rather prevalent panic brought on by economists in nearly every corner of the world.
Both of those lessons, were wrong for the COVID recession.
The U.S. economy needed far less monetary and congressional action, and whatever the scale, it needed it for far less time to resume a recovery.
The overshoot on action and time has led to persistent inflation levels not seen in forty years, according to some measures.
One thing that has not changed since the GFC is the paranoia and calls for doom.
Up until recently, the calmer cognoscenti had little to offer in terms of data. They do now.
Alas, there is reason to believe that disinflation has begun. And while some of it is simply a return to equilibrium, some of it too, has been brought about by aggressive Fed signaling.
We believe that the Fed, while serious about tightening policies, is also attempting to scare the economy out of inflation with purpose driven messaging. The demand side of inflation may have its cure in that messaging, and the supply side is easing now too, likely simply due to a return to normalcy.
Trucking Rates
We can start our trend analysis with trucking rates. While the U.S. logistics snarls are many fold, trucking was one of the crucial irritants.
Measuring price vacillations for trucking using the Truckstop.com 7-day van rate per mile rates, we have objective data that supports disinflation.
Here is chart number one, which comes a from a September 2020 post on the website freightwaves.com.
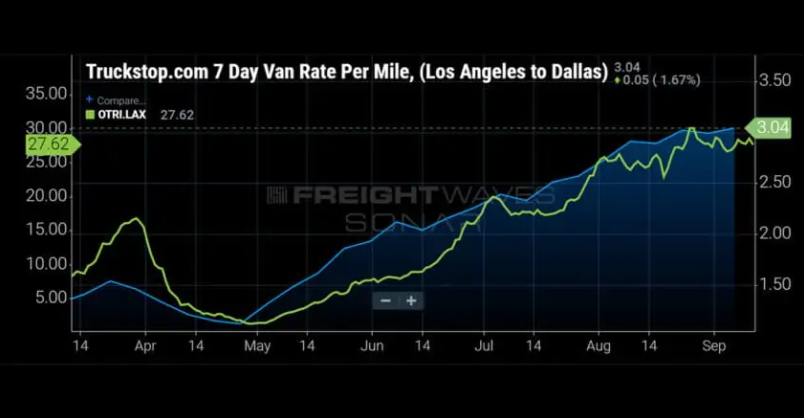
In this first image, which pictures the 7-day van rate per mile, we can see that in mid-March of 2020, the rate was well below $1.50 / mile. The chart also illustrates the start of inflation that was to come.
From that $1.50 / mile price, rates rose to $3.04 by September of 2020, and with the benefit of hindsight, we know that the rates peaked at over $3.80, over a 200% increase from 2020.
Inflation in trucking rates per mile have spiked. But we do have new data that suggests that while the rates are still onerously high, they have peaked, and are clearly in a deflationary trend.
Here is chart number two, from the middle of March 2022.
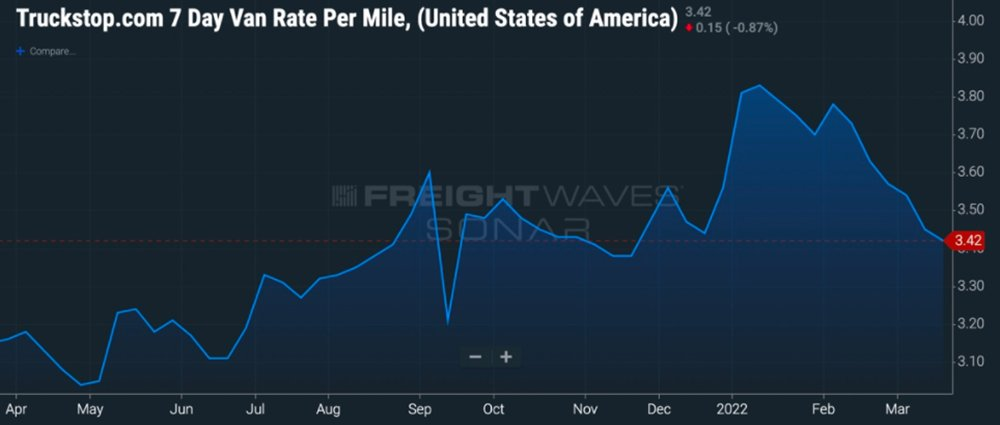
The spot rate has dropped from the peak of $3.80 to, at the time, $3.42. More recent data shows the spot rate down to below $3.30.
While the rate is still substantially inflated, the downward trajectory has continued and appears persistent.
That potential persistence is driven both by a growth in supply of truckers and a decline in demand.
Our final chart on this subject examines outbound tender volume.
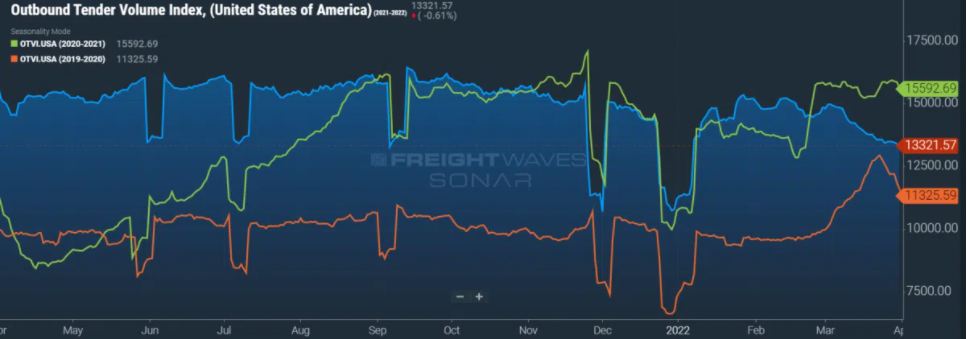
The orange line traces the outbound tender volume index in the United States for 2019-2020.
The green line traces the outbound tender volume index in the United States for 2020-2021.
We can see the rather dramatic rise in the latter versus the former.
Finally, the blue fill line traces 2021-2022. We can see a move toward normalcy (2019-2020 levels), and a rather sharp recent decline.
Trucking rates are inflated as is outbound tender volume, but both are on a downward trajectory signaling current and potentially future deflation.
Next, we can move to used auto prices.
Used automobile prices
Other than fuel prices, used auto prices have experienced the largest inflation of all goods consumed by the CPI computation.
This extreme inflation has been driven in large part by a shortage in semi-conductors.
But, in early February, Barron's published an article noting that “used-car prices aren’t soaring anymore."
With more data from March, we find not just confirming data, but now a downward trajectory.
Our first chart illustrates the Manheim Used Vehicle Value Index in a time series from January 1995 through March 2022.
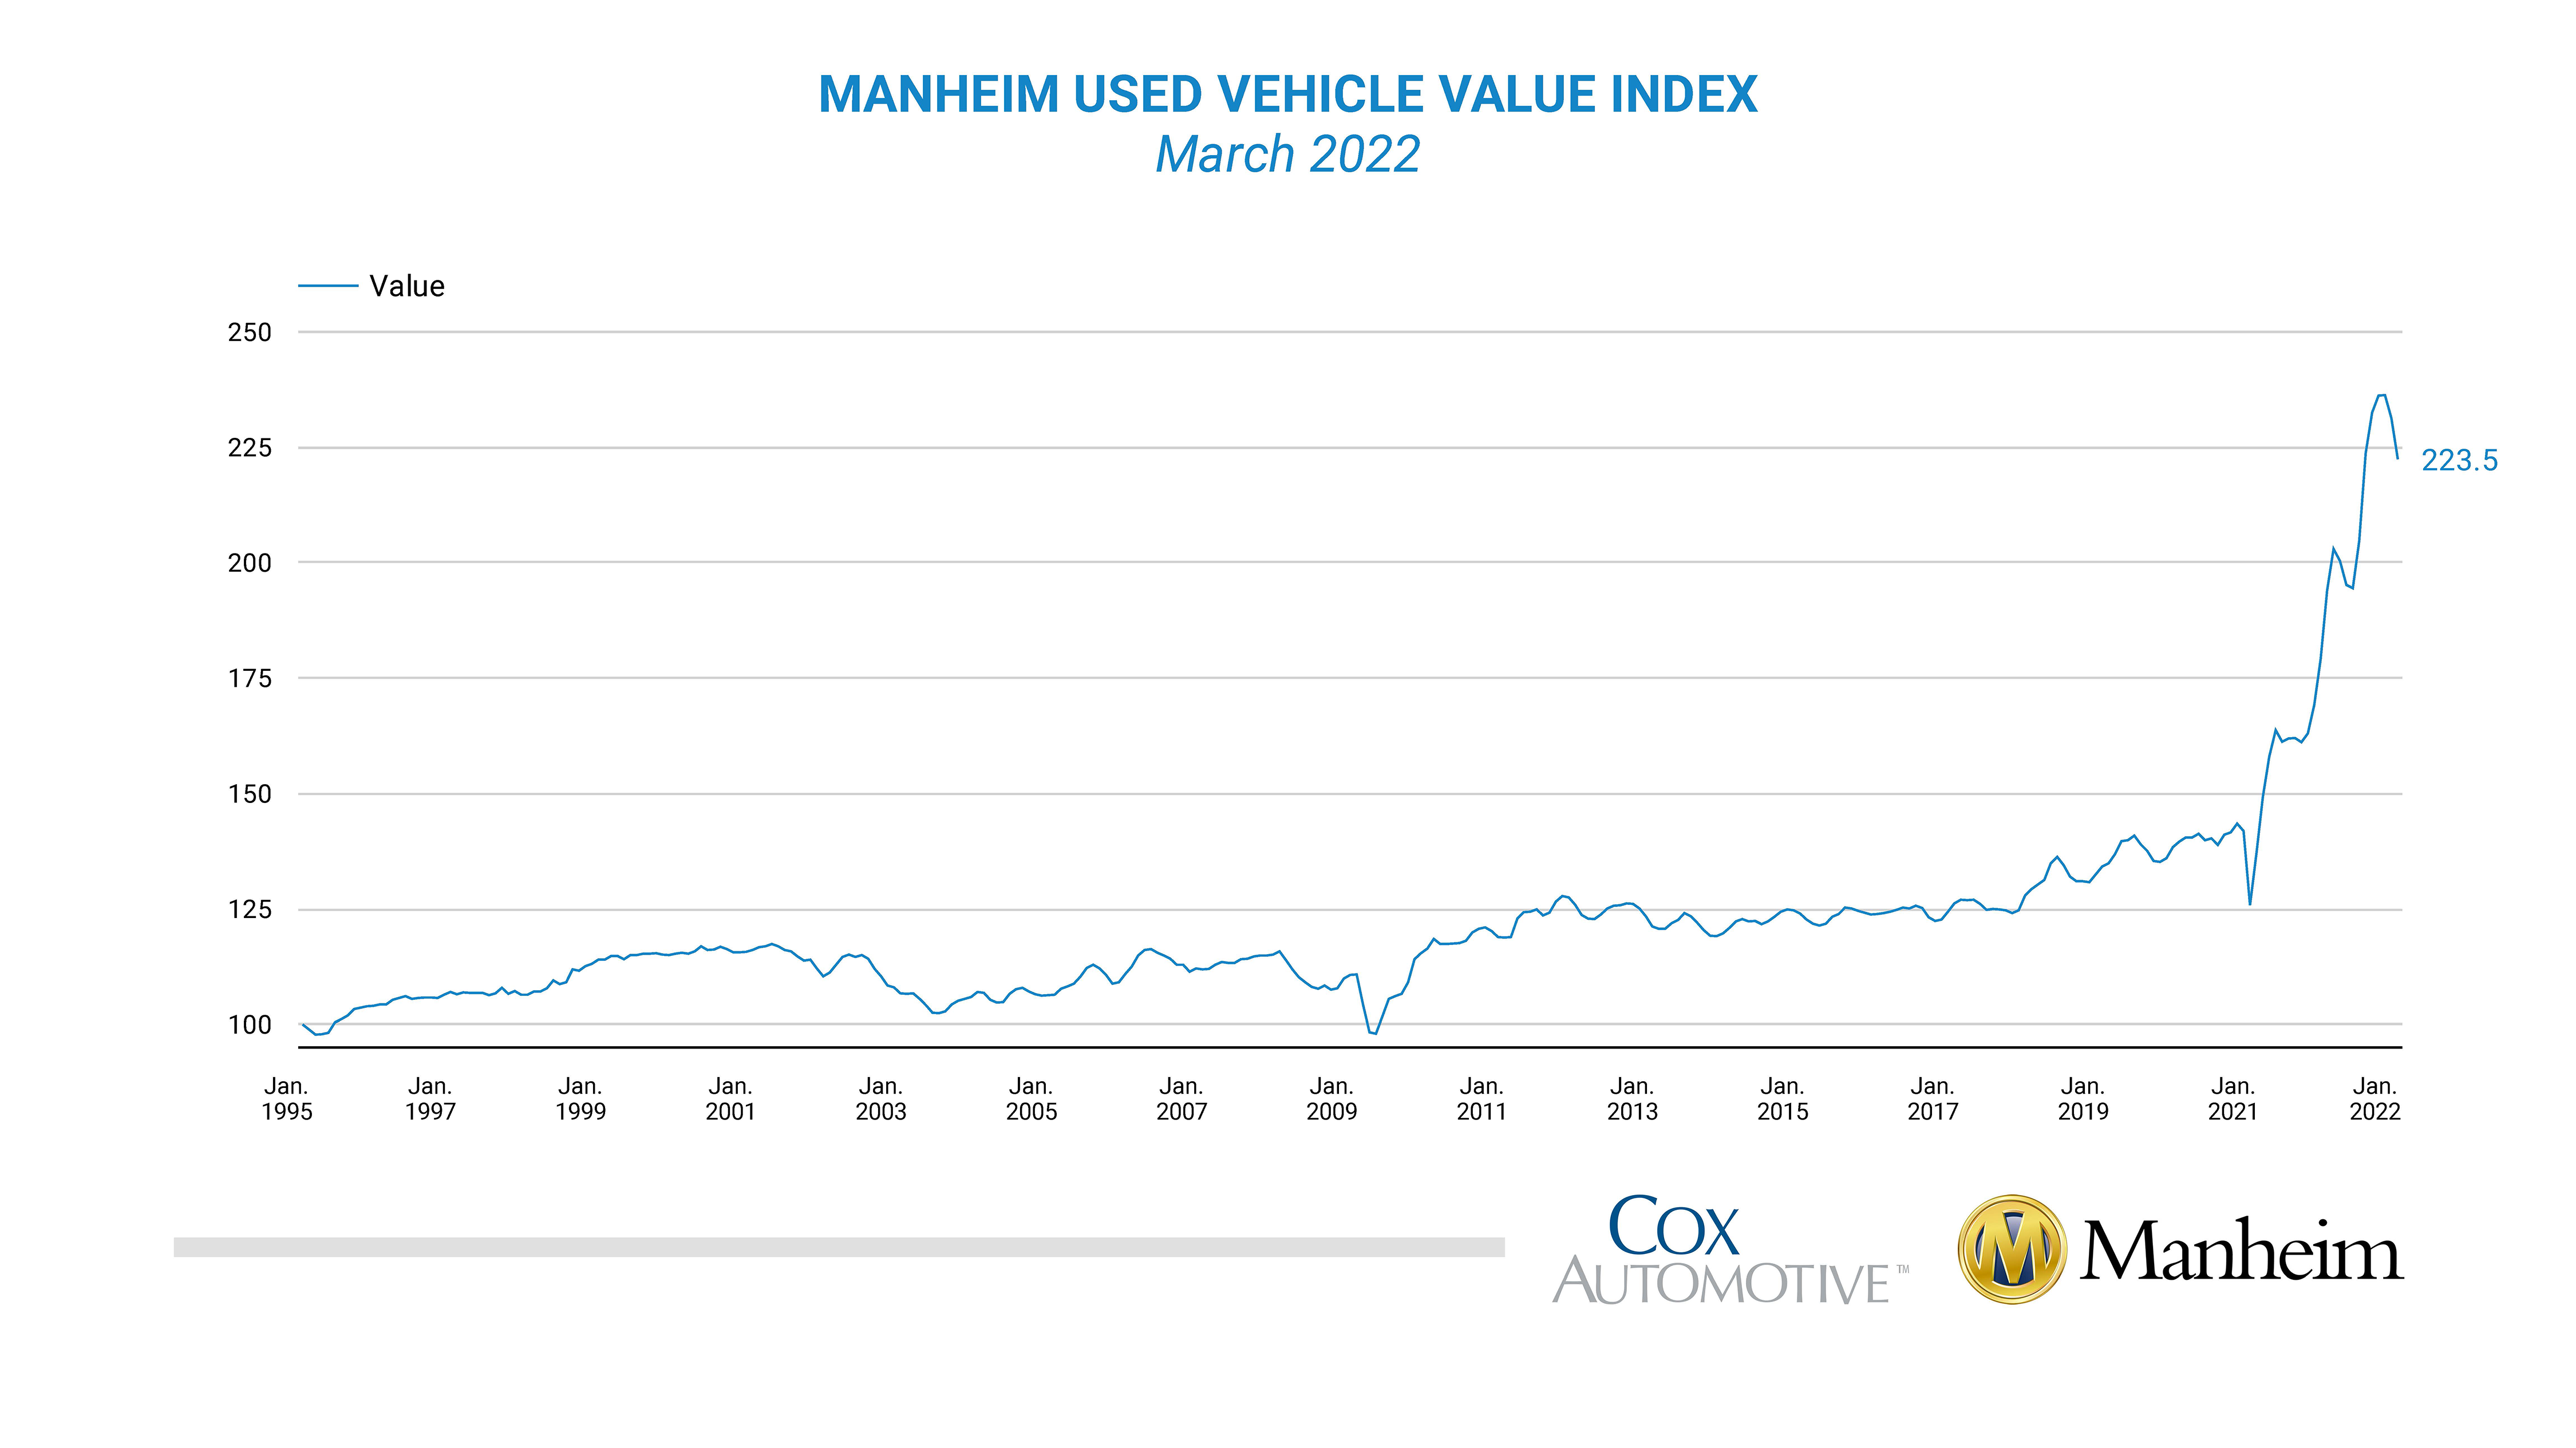
The trend has turned. We can turn to a table of values from the same source, for more clarity.
From February 2020 to January 2022, the index rose 65%. From January 2022 through March 2022, the index has fallen two consecutive months, totaling a 5.4% drop.
It ain't good, but it's getting better.
We now see consecutive months of deflationary pressure and a decrease in the year over year change from the same periods one-, and two-years ago.
Now, let's turn to shipping rates and port congestion.
Shipping rates and port congestion
One of the most publicly discussed aspects of the supply chain has been both port congestion and shipping costs.
When examining these two phenomena, we see data trending down, albeit far from prior equilibrium levels.
The World Container Index assessed by Drewry is a composite of the 8 route indices weighted for volume on each of the routes representative trade. Volume is expressed in Million TEU's.
The eight routes represented consist of the following:
• Shanghai - Rotterdam
• Rotterdam - Shanghai
• Shanghai - Genoa
• Shanghai - Los Angeles
• Los Angeles - Shanghai
• Shanghai - New York
• New York - Rotterdam
• Rotterdam - New York
Here is our first chart, this one surrounding demand as measured in volume from Drewry.
We can observe a clear reduction in volumes, now for several months in a row, and now back to levels last seen in June of 2021.
Next, we can turn to actual cost per route, from the same source, for routes initiating from Shanghai.
The Shanghai to New York route is down 30% from the peak reached in September of 2021, the most of any of the four, while the route from Shanghai to Genoa is down the least, 11% year-over-year.
While prior levels, pre-COVID, are far lower, we see clear and persistent deflation, as of today.
Story
Inflation started almost immediately following the Federal Reserve and Congressional action taken to combat the nearly immediate COVID induced recession. Two key lessons learned from the Great Financial Crisis (GFC) were applied to the COVID recession, and unfortunately, both were wrong.The GFC required a bazooka of Fed action, measured in trillions and required a long lasting monetary easing paradigm to ultimately stave off a depression. That was lesson one.
Lesson two was that such an architecture of monetary policy did not create inflation, irrespective of the rather prevalent panic brought on by economists in nearly every corner of the world.
Both of those lessons, were wrong for the COVID recession.
The U.S. economy needed far less monetary and congressional action, and whatever the scale, it needed it for far less time to resume a recovery.
The overshoot on action and time has led to persistent inflation levels not seen in forty years, according to some measures.
One thing that has not changed since the GFC is the paranoia and calls for doom.
Up until recently, the calmer cognoscenti had little to offer in terms of data. They do now.
Some disinflation, and even deflation, has begun - yes it has
Inflation can be seen in many areas, from used automobile prices, new automobile prices, trucking rates, shipping rates, port congestion, housing prices, imbalances between manufacturing demand and supply, a substantial workforce participation rate drop, and many others.Alas, there is reason to believe that disinflation has begun. And while some of it is simply a return to equilibrium, some of it too, has been brought about by aggressive Fed signaling.
We believe that the Fed, while serious about tightening policies, is also attempting to scare the economy out of inflation with purpose driven messaging. The demand side of inflation may have its cure in that messaging, and the supply side is easing now too, likely simply due to a return to normalcy.
Trucking Rates
We can start our trend analysis with trucking rates. While the U.S. logistics snarls are many fold, trucking was one of the crucial irritants.
Measuring price vacillations for trucking using the Truckstop.com 7-day van rate per mile rates, we have objective data that supports disinflation.
Here is chart number one, which comes a from a September 2020 post on the website freightwaves.com.
In this first image, which pictures the 7-day van rate per mile, we can see that in mid-March of 2020, the rate was well below $1.50 / mile. The chart also illustrates the start of inflation that was to come.
From that $1.50 / mile price, rates rose to $3.04 by September of 2020, and with the benefit of hindsight, we know that the rates peaked at over $3.80, over a 200% increase from 2020.
Inflation in trucking rates per mile have spiked. But we do have new data that suggests that while the rates are still onerously high, they have peaked, and are clearly in a deflationary trend.
Here is chart number two, from the middle of March 2022.
The spot rate has dropped from the peak of $3.80 to, at the time, $3.42. More recent data shows the spot rate down to below $3.30.
While the rate is still substantially inflated, the downward trajectory has continued and appears persistent.
That potential persistence is driven both by a growth in supply of truckers and a decline in demand.
Our final chart on this subject examines outbound tender volume.
The orange line traces the outbound tender volume index in the United States for 2019-2020.
The green line traces the outbound tender volume index in the United States for 2020-2021.
We can see the rather dramatic rise in the latter versus the former.
Finally, the blue fill line traces 2021-2022. We can see a move toward normalcy (2019-2020 levels), and a rather sharp recent decline.
Trucking rates are inflated as is outbound tender volume, but both are on a downward trajectory signaling current and potentially future deflation.
Next, we can move to used auto prices.
Used automobile prices
Other than fuel prices, used auto prices have experienced the largest inflation of all goods consumed by the CPI computation.
This extreme inflation has been driven in large part by a shortage in semi-conductors.
But, in early February, Barron's published an article noting that “used-car prices aren’t soaring anymore."
With more data from March, we find not just confirming data, but now a downward trajectory.
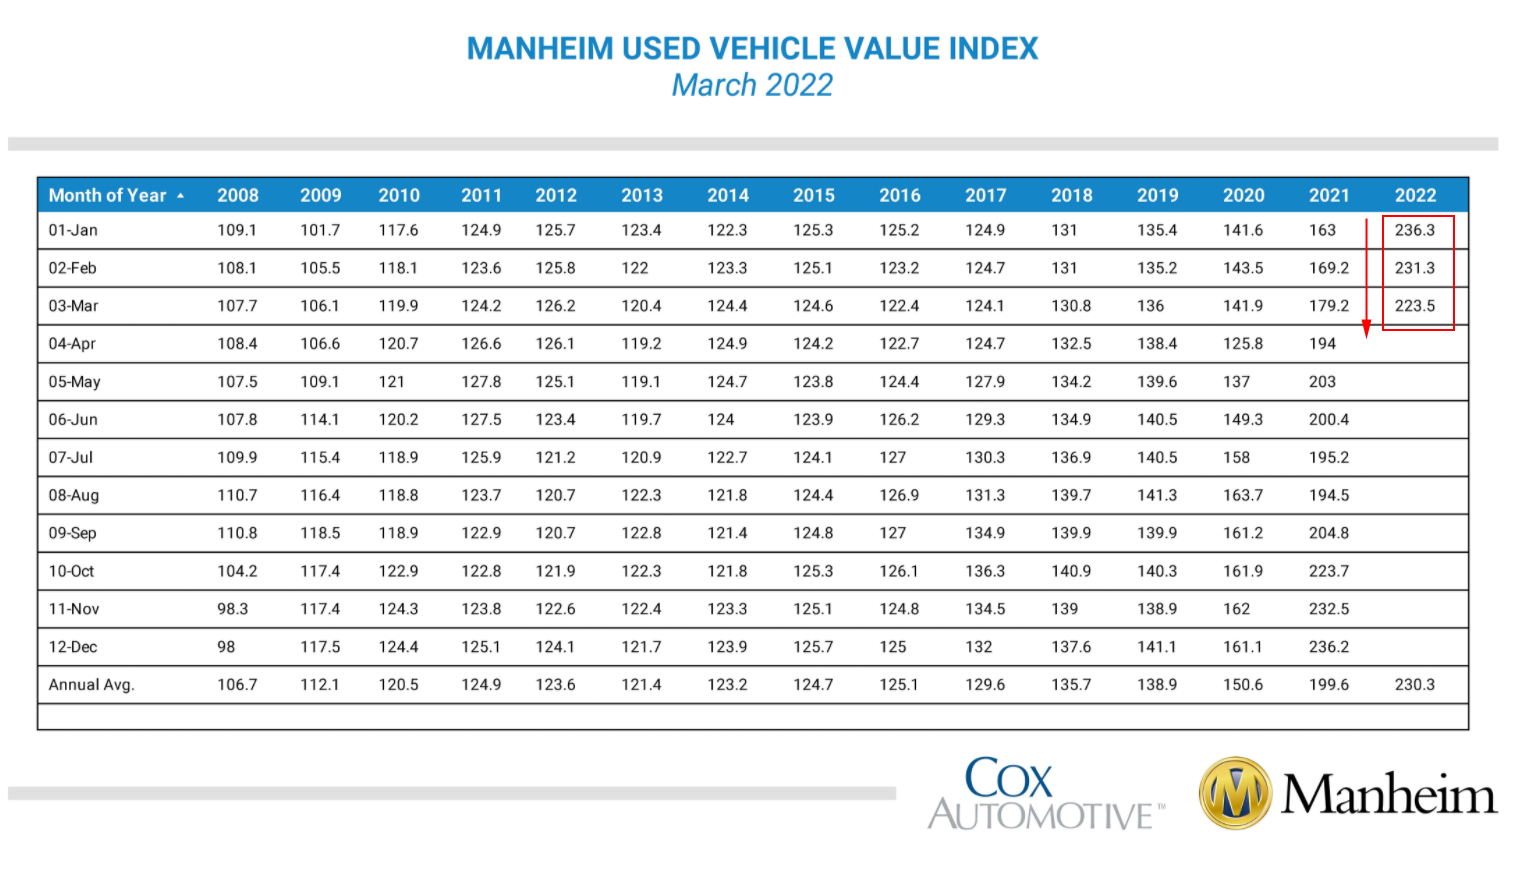
Our first chart illustrates the Manheim Used Vehicle Value Index in a time series from January 1995 through March 2022.
The trend has turned. We can turn to a table of values from the same source, for more clarity.
From February 2020 to January 2022, the index rose 65%. From January 2022 through March 2022, the index has fallen two consecutive months, totaling a 5.4% drop.
It ain't good, but it's getting better.
We now see consecutive months of deflationary pressure and a decrease in the year over year change from the same periods one-, and two-years ago.
Now, let's turn to shipping rates and port congestion.
Shipping rates and port congestion
One of the most publicly discussed aspects of the supply chain has been both port congestion and shipping costs.
When examining these two phenomena, we see data trending down, albeit far from prior equilibrium levels.
The World Container Index assessed by Drewry is a composite of the 8 route indices weighted for volume on each of the routes representative trade. Volume is expressed in Million TEU's.
The eight routes represented consist of the following:
• Shanghai - Rotterdam
• Rotterdam - Shanghai
• Shanghai - Genoa
• Shanghai - Los Angeles
• Los Angeles - Shanghai
• Shanghai - New York
• New York - Rotterdam
• Rotterdam - New York
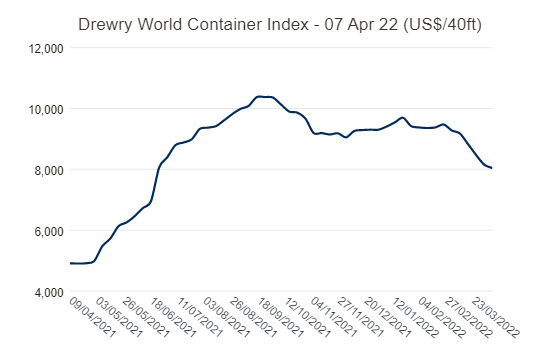
Here is our first chart, this one surrounding demand as measured in volume from Drewry.
We can observe a clear reduction in volumes, now for several months in a row, and now back to levels last seen in June of 2021.
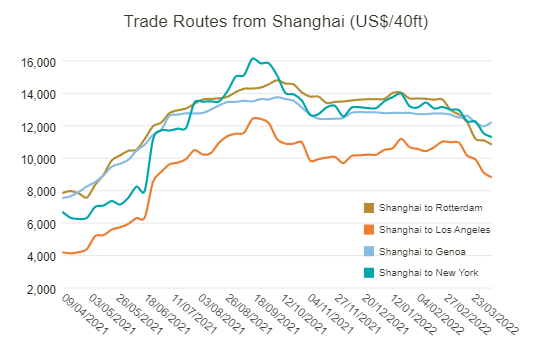
Next, we can turn to actual cost per route, from the same source, for routes initiating from Shanghai.
The Shanghai to New York route is down 30% from the peak reached in September of 2021, the most of any of the four, while the route from Shanghai to Genoa is down the least, 11% year-over-year.
While prior levels, pre-COVID, are far lower, we see clear and persistent deflation, as of today.
Will China's COVID outbreak and zero-COVID policy worsen this? Likely, yes. But there is no way to get out of the supply chain mess without the beginnings of success, and we have the beginnings. A COVID outbreak in China will be temporary, and we should continue to see the same deflationary pressures persist.
Now, we can turn to home prices.
Home Prices
Home price inflation has been substantial compared to pre-COVID times.
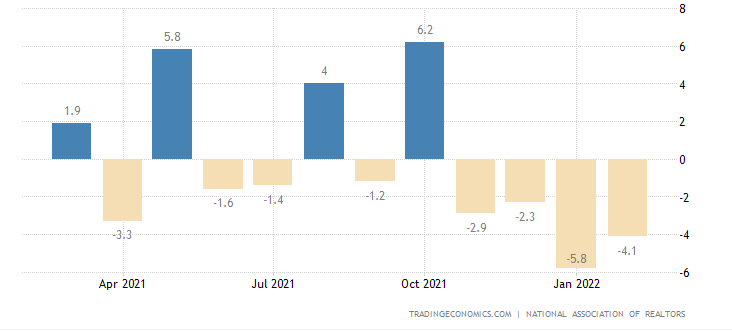
But, the latest pending home sales report contract signings in February 2022 were down across all regions of the U.S. except in the Northeast. All four regions registered a decline in year-over-year contract activity.
The indexed drop was a 4.1% decline, versus estimates of a 1% gain.
This drop is noteworthy because it was not just the fourth consecutive month of falling contracts, but the expectation was for a gain, while a substantial decline instead ensued.
Here is a chart from Trading Economics which illustrates month over month changes in pending home sales.
Declining contracts aren't necessarily a sign of deflation in this environment since an argument can be made that it is not the demand side that has shrunk but rather the supply side that has been impacted amid a persistent shortage of properties.
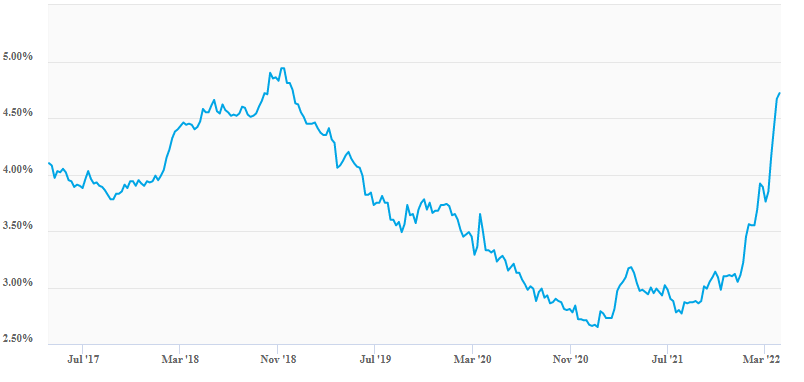
But, given the hawkish messaging from the Fed, mortgage rates have spiked, and plausibly impact the demand side.
We may know more about the demand side when the March pending home sales report comes out.
In a report today from CNBC, we learned that rising mortgage rates are causing more home sellers to lower their asking prices.
The report reads that "about 12% of homes for sale had a price drop during the four weeks ending April 3. That’s up from 9% a year ago, according to Redfin."
Further, "the rate of sellers dropping their asking prices is now growing faster each month than it has since August."
This is circumstantial evidence that the housing market is experiencing disinflation, and may well face deflation in the coming months.
Now we can turn to manufacturing inflation.
Manufacturing inflation
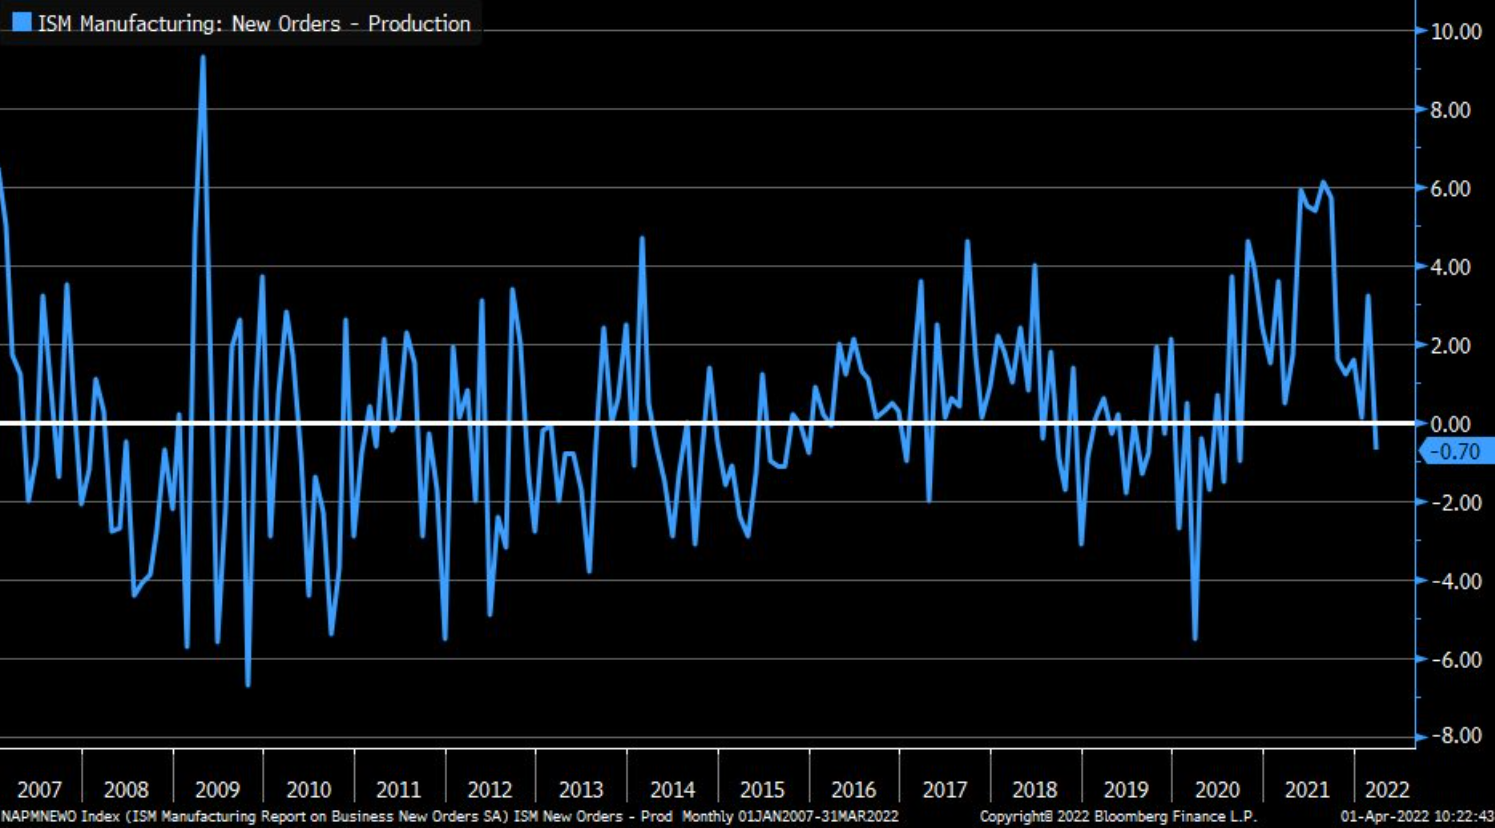
The US ISM Manufacturing New Orders Index has dropped from its highs, per YCHARTS.
Further, Liz Ann Sonders (Chief Investment Strategist, Charles Schwab & Co.) noted that the spread between new orders and production components within March ISM Manufacturing Index has tumbled and is at its lowest level since late-2020, referencing this chart:
Now, we can turn to home prices.
Home Prices
Home price inflation has been substantial compared to pre-COVID times.
But, the latest pending home sales report contract signings in February 2022 were down across all regions of the U.S. except in the Northeast. All four regions registered a decline in year-over-year contract activity.
The indexed drop was a 4.1% decline, versus estimates of a 1% gain.
This drop is noteworthy because it was not just the fourth consecutive month of falling contracts, but the expectation was for a gain, while a substantial decline instead ensued.
Here is a chart from Trading Economics which illustrates month over month changes in pending home sales.
Declining contracts aren't necessarily a sign of deflation in this environment since an argument can be made that it is not the demand side that has shrunk but rather the supply side that has been impacted amid a persistent shortage of properties.
But, given the hawkish messaging from the Fed, mortgage rates have spiked, and plausibly impact the demand side.
We may know more about the demand side when the March pending home sales report comes out.
In a report today from CNBC, we learned that rising mortgage rates are causing more home sellers to lower their asking prices.
The report reads that "about 12% of homes for sale had a price drop during the four weeks ending April 3. That’s up from 9% a year ago, according to Redfin."
Further, "the rate of sellers dropping their asking prices is now growing faster each month than it has since August."
This is circumstantial evidence that the housing market is experiencing disinflation, and may well face deflation in the coming months.
Now we can turn to manufacturing inflation.
Manufacturing inflation
The US ISM Manufacturing New Orders Index has dropped from its highs, per YCHARTS.
Further, Liz Ann Sonders (Chief Investment Strategist, Charles Schwab & Co.) noted that the spread between new orders and production components within March ISM Manufacturing Index has tumbled and is at its lowest level since late-2020, referencing this chart:
While the rolled up PPI for all commodities is still on the rise, there are clear signs of deflation in several areas:
• Plastics materials and resins manufacturing
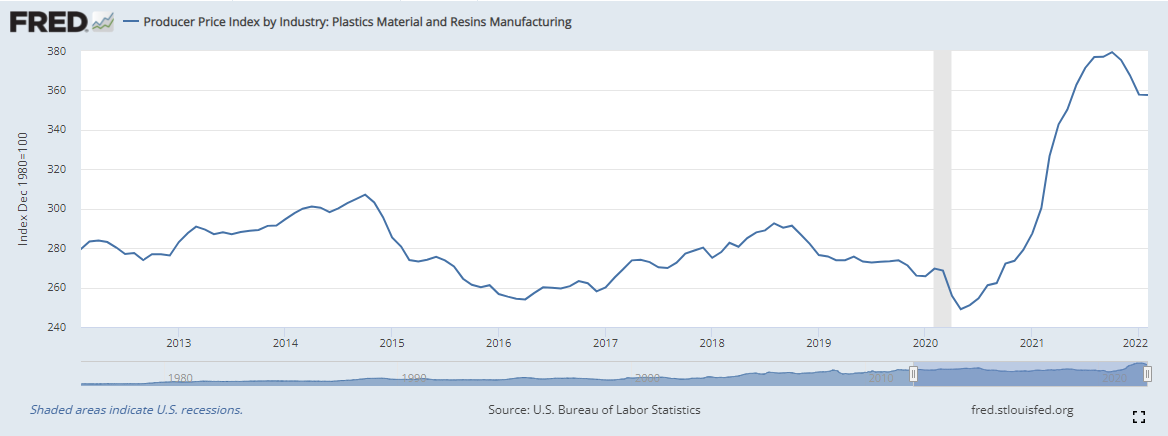
• Pulp, paper, and allied products
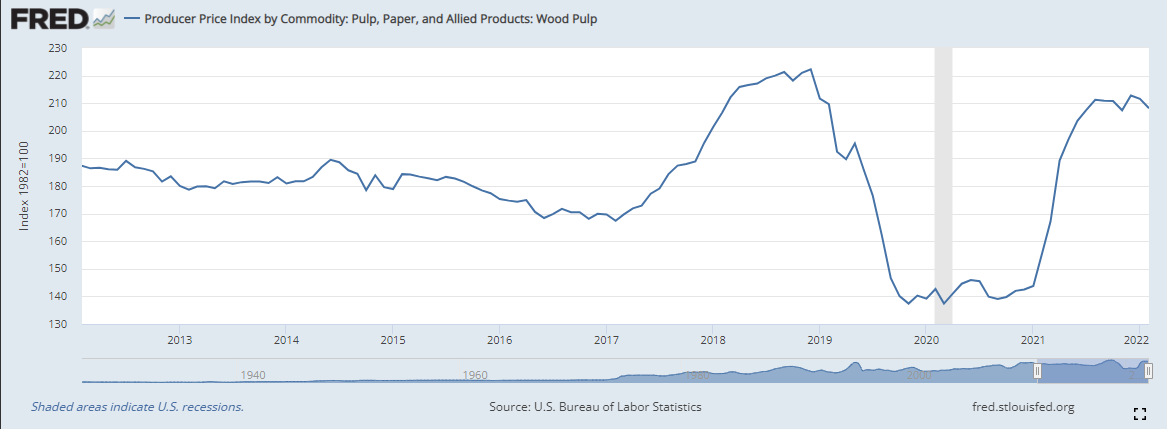
• Materials and metal products: Iron and Steel
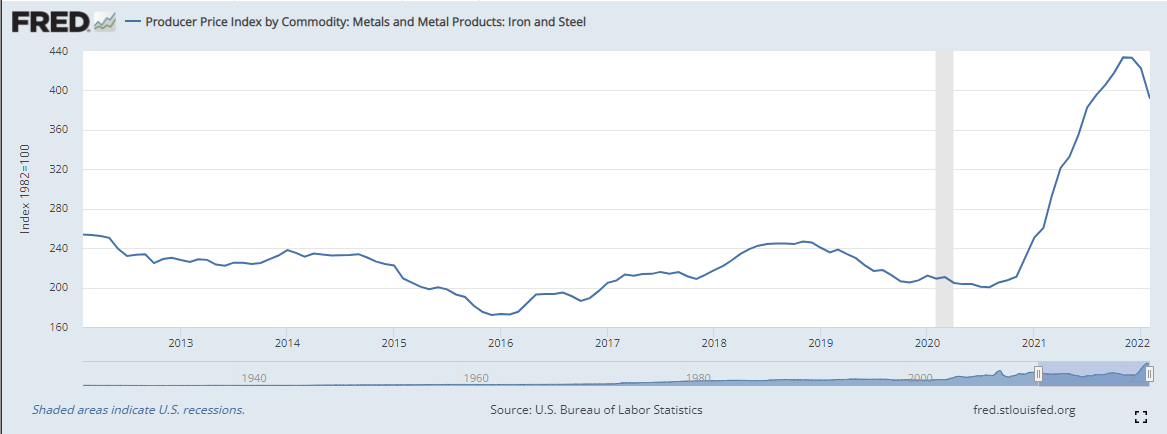
With supply and demand reaching equilibrium and inventories building, manufacturing inflation could ease.
Now we can move to labor force participation and wage inflation.
Labor force participation and wage inflation
Labor force participation and wage inflation
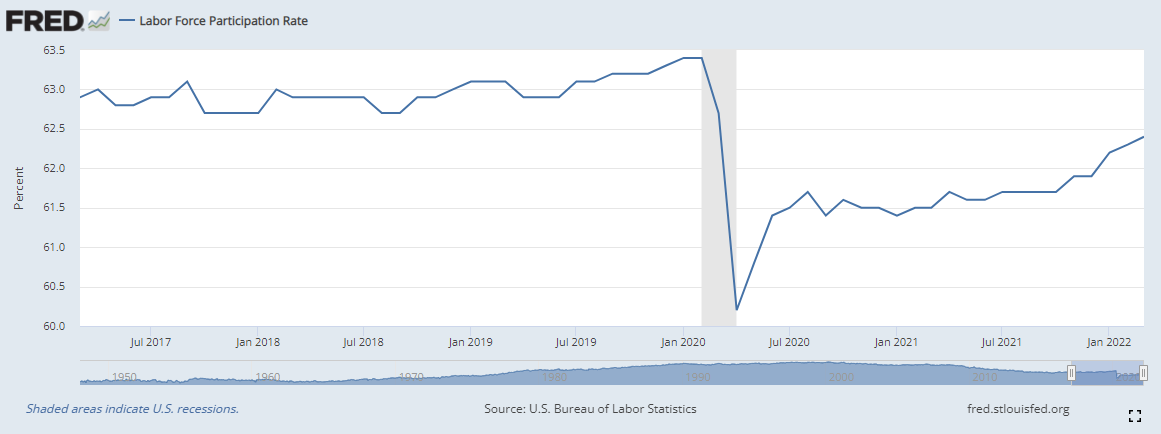
We can see from FRED data, that the labor force contracted abruptly when the COVID outbreak first hit in the United States.
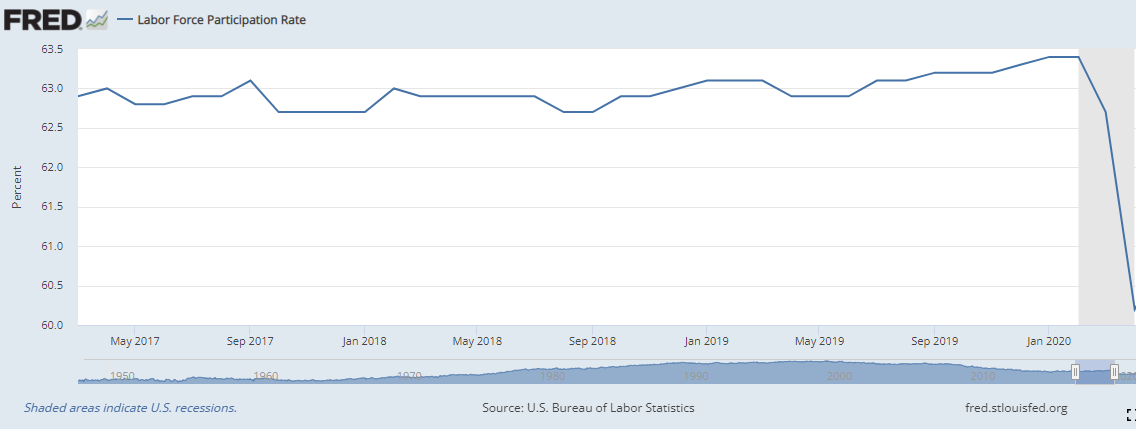
The labor force slowly recovered but then hit, what appeared to be, a new equilibrium far lower than pre-COVID, giving rise to the phrase the "great Resignation."
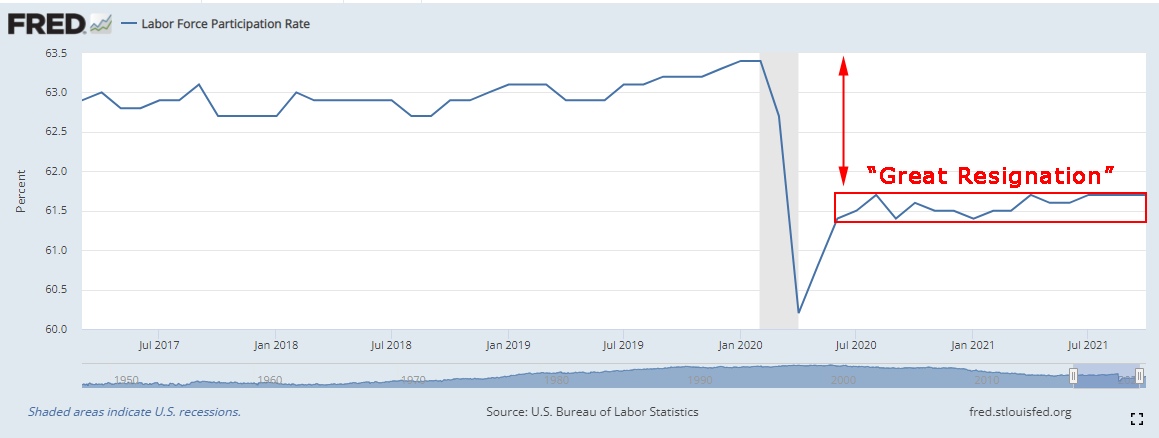
But it turns out that the dip in labor force participation rate may very well have been in direct response to fears of working with COVID and from women leaving the workforce temporarily to care for family.
Indeed, the current chart of labor force participation shows a consistent rise out of the prior lull.
We can also look at prime age labor force participation (25-54 year-old).
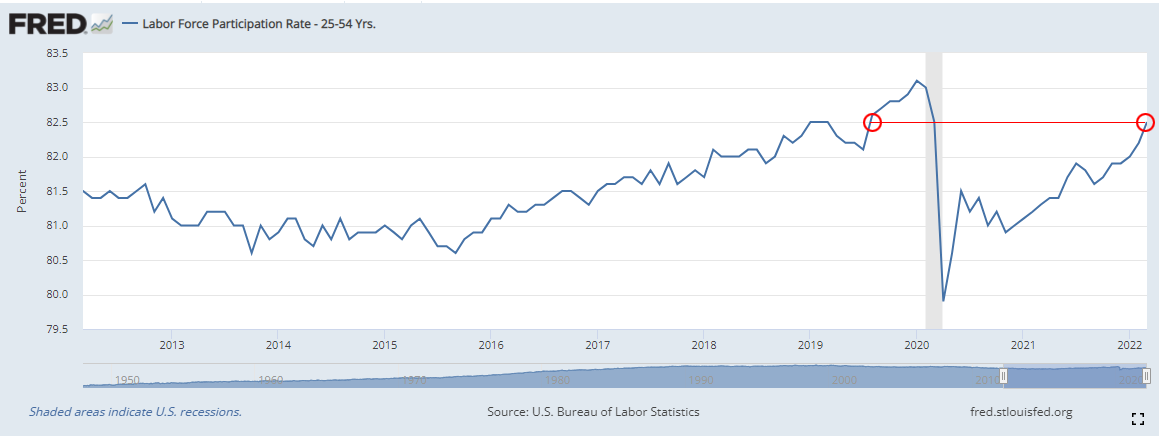
Not only has the prime age participation rate risen back to levels last seen in August 2019, it is above levels registered in 2013-2018.
A rising labor force is a supply increase, possibly easing wage inflation. In fact, the jobs report on March 4, 2022 showed not just higher labor force participation, but no wage inflation.
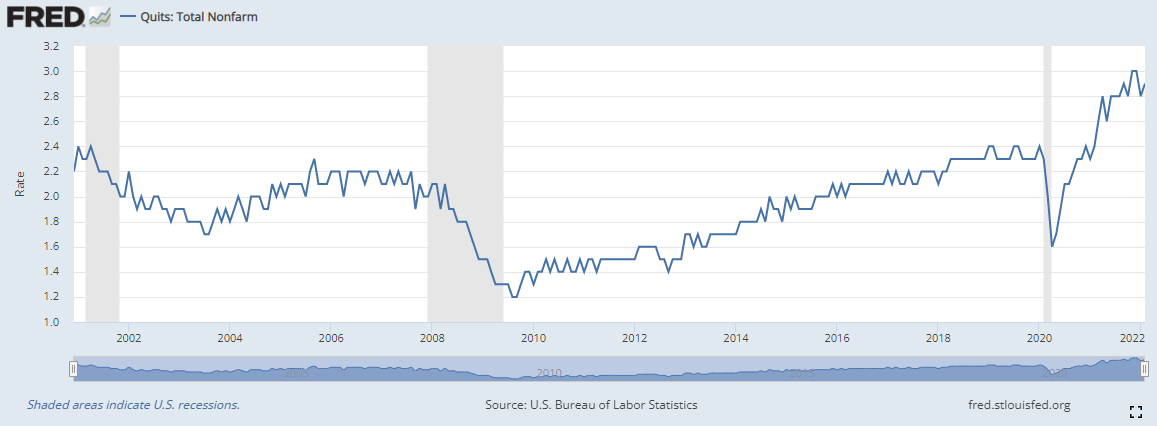
Further, a new Fed Study showed that there may have been nothing unusual about quit rates.
Bart Hobijn, a visiting fellow with the regional Fed’s research department and a professor of economics at Arizona State University wrote "evidence from both recent worker surveys and historical data on quits shows that the ‘Great Resignation’ is not as unusual as one might think."
Further, he noted that "the quits waves in manufacturing in 1948, 1951, 1953, 1966, 1969, and 1973 are of the same order of magnitude as the current wave. All of these waves coincide with periods when payroll employment grew very fast, both in the manufacturing sector and the total nonfarm sector."
Indeed, the current chart of labor force participation shows a consistent rise out of the prior lull.
The labor force slowly recovered but then hit, what appeared to be, a new equilibrium far lower than pre-COVID, giving rise to the phrase the "great Resignation."
But it turns out that the dip in labor force participation rate may very well have been in direct response to fears of working with COVID and from women leaving the workforce temporarily to care for family.
Indeed, the current chart of labor force participation shows a consistent rise out of the prior lull.
We can also look at prime age labor force participation (25-54 year-old).
Not only has the prime age participation rate risen back to levels last seen in August 2019, it is above levels registered in 2013-2018.
A rising labor force is a supply increase, possibly easing wage inflation. In fact, the jobs report on March 4, 2022 showed not just higher labor force participation, but no wage inflation.
Further, a new Fed Study showed that there may have been nothing unusual about quit rates.
Bart Hobijn, a visiting fellow with the regional Fed’s research department and a professor of economics at Arizona State University wrote "evidence from both recent worker surveys and historical data on quits shows that the ‘Great Resignation’ is not as unusual as one might think."
Further, he noted that "the quits waves in manufacturing in 1948, 1951, 1953, 1966, 1969, and 1973 are of the same order of magnitude as the current wave. All of these waves coincide with periods when payroll employment grew very fast, both in the manufacturing sector and the total nonfarm sector."
Indeed, the current chart of labor force participation shows a consistent rise out of the prior lull.
In any case, the quit rate appears to have peaked, as we see in the chart below.
Conclusion
There is substantial objective data to support the claim that the worst of inflation in many parts of the economy has peaked and further, that deflation has begun to take hold.Inflation is still substantially elevated and the war in Ukraine will push inflation higher in some areas of the economy. But, some parts of the inflationary story have turned, and others appear about to turn.
It isn't good; but it is better. And when there is enough better, we get good, and that means stock price appreciation.
So, what now?
It’s finding the technology gems before they are household names, that can turn into the 'next Google,’ or 'next Apple,’ where we have to get ahead of the curve. This is what CML Pro does, with an auditor verified track record, because of course it's verified.
Each company in our 'Top Picks’ has been selected as a future crown jewel of technology. Market correction or not, recession or not, the growth in these areas is a near certainty.
The precious few thematic top picks, research dossiers, and alerts are available for a limited time at a 30% discount.
Each company in our 'Top Picks’ has been selected as a future crown jewel of technology. Market correction or not, recession or not, the growth in these areas is a near certainty.
The precious few thematic top picks, research dossiers, and alerts are available for a limited time at a 30% discount.
Thanks for reading friends.
Legal
The information contained on this site is provided for general informational purposes, as a convenience to the readers. The materials are not a substitute for obtaining professional advice from a qualified person, firm or corporation. Consult the appropriate professional advisor for more complete and current information. Capital Market Laboratories (“The Company”) does not engage in rendering any legal or professional services by placing these general informational materials on this website.
The Company specifically disclaims any liability, whether based in contract, tort, strict liability or otherwise, for any direct, indirect, incidental, consequential, or special damages arising out of or in any way connected with access to or use of the site, even if I have been advised of the possibility of such damages, including liability in connection with mistakes or omissions in, or delays in transmission of, information to or from the user, interruptions in telecommunications connections to the site or viruses.
The Company makes no representations or warranties about the accuracy or completeness of the information contained on this website. Any links provided to other server sites are offered as a matter of convenience and in no way are meant to imply that The Company endorses, sponsors, promotes or is affiliated with the owners of or participants in those sites, or endorse any information contained on those sites, unless expressly stated.