


Option Trading: Buy or Sell Straddles in Group 1 Automotive Inc (NYSE:GPI)

Group 1 Automotive Inc (NYSE:GPI) : Trading Straddles
Date Published: 2023-05-22Disclaimer
The results here are provided for general informational purposes from the CMLviz Trade Machine Stock Option Backtester as a convenience to the readers. The materials are not a substitute for obtaining professional advice from a qualified person, firm or corporation.OPENING
As we look at Group 1 Automotive Inc we note that deciding whether to buy or sell options (in this case a straddle) is probably the most important question when it comes to option trading. But a cursory analysis of a short straddle will miss the fine points required -- especially surrounding earnings.
There's a broader question we are looking to answer -- has owning options or selling options been the winner in Group 1 Automotive Inc (NYSE:GPI) .
Option trading is volatility trading, whether we mean it to be or not. If that sounds a little weird to you, we actually suggest you stop reading this article, and instead read our option primer: Understanding Option Skew -- What it is and Why it Exists.
If you're already on top of volatility and the impact it has on option trading and earnings -- let's get going.
STORY
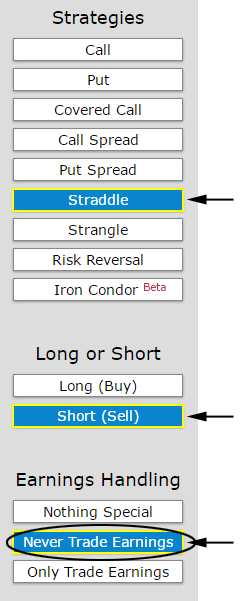
There's lot less luck involved in successful option trading than some people have come to know. We'll get specific with short straddles on GPI. Let's look at a three-year back-test of a short straddle strategy with these quick guidelines:
* Test monthly options (roll the trade every 30-days).
* Avoid earnings.
* Examine the at the money straddles.
* Test a short straddle looking back at three-years of data.
We want to introduce how easy this is with the right tools but also how important it is to make sure you use them. Just tap the appropriate settings.
And now the findings.
RESULTS
If we did this short straddle in Group 1 Automotive Inc (NYSE:GPI) over the last three-years but always skipped earnings we get these findings:| short 50 Delta Straddle | ||||
| * Trade Frequency: 30 Days | ||||
| * Back-test length: three-years | ||||
| * Always Avoid Earnings | ||||
| Gross Gain: | $19,557 | |||
| Gross Loss: | -$16,892 | |||
| Wins: 27 | Losses: | 18 | ||
| Short Straddle Return: | 58.6% | |||
Selling an uncovered straddle every 30-days in GPI has been a pretty substantial winner over the last three-years returning 58.6%. But there is a surprise we get when we examine short straddles that were held during earnings.
GOING FURTHER WITH GROUP 1 AUTOMOTIVE INC
That first step of analyzing a short straddle while avoiding earnings is nice -- but let's go deeper.
Let's look at the same analysis, but we will only look at earnings. Specifically, we will short the straddle two-days before earnings, then close the option position two-days after earnings.
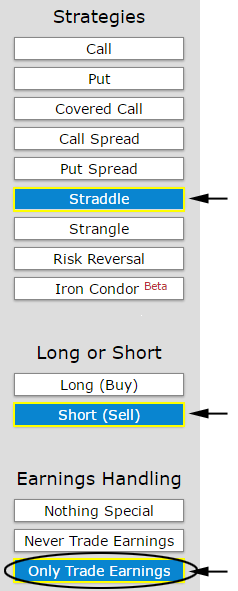
Here are those results for the same short straddle:
| short 50 Delta Straddle | ||||
| * Trade Frequency: 30 Days | ||||
| * Back-test length: three-years | ||||
| * Only Trade Earnings | ||||
| Gross Gain: | $2,888 | |||
| Gross Loss: | -$457 | |||
| Wins: 10 | Losses: | 2 | ||
| Short Straddle Return: | 73.2% | |||
Selling an uncovered straddle in Group 1 Automotive Inc during earnings proved to be a big winner, more importantly, it returned more than the same short straddle that avoided earnings. While this clever use of earnings has outperformed the short straddle that avoided earnings, the question of risk is still in play. Having an option position during earnings is one of the riskiest implementations possible. The point is not that earnings were so strong -- there's a bigger picture here.
Having historical analysis in hand before option trading maps the decision process about what to trade, when to trade, and even if the trade is worth it at all. Now let's go beyond Group 1 Automotive Inc and trading short straddles to something that makes a difference in our trading lives.
Please note that the executions and other statistics in this article are hypothetical, and do not reflect the impact, if any, of certain market factors such as liquidity and slippage.