Alphabet Inc - Ordinary Shares - Class A


Why Google Is Doing a Lot, and May Be Ready to Rip
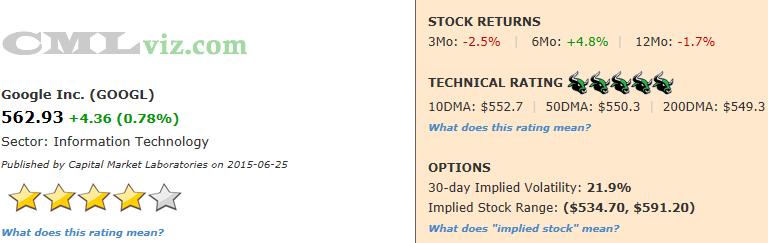
Fundamentals Technicals | Support: 543 | Resistance: 563.39 
We all want to talk about Google's social media move. In fact, I'm pretty sure I saw tweet noodling the idea of GOOGL acquiring Chinse social media company Weibo (WB). Of course, the focus is Twitter (TWTR). Let us remember that Google's revenue in the last year tops $67 billion, while Twitter's is under $2 billion. Certainly the goal would be synergies, and the dismantling of Google Plus makes now a very compelling time for an acquisition especially considering Google Photos (discussed later) is apparently a pure play at Facebook's Instagram. How would Twitter paired with that look?
But for now, Twitter is an after thought until it becomes the only thought. We'll do that, but at the end. There is so much going on at Google that we must address first in order to understand where Twitter fits in this mega-mega cap's business.
Google stock has been stuck. There are no arguments there. But, a narrative has been forming that Google as a core equity holding is dead -- a narrative which in many ways is off target. Google's earnings (TTM) are at an all-time high while R&D and revenue (TTM) are just below all-time highs. In 2006, Apple and Google were spending about the same amount on R&D. By 2008, Google was spending about $1 billion more annually than Apple. As of today, Google spends about $4 billion more in R&D than Apple. GOOGL spends more on R&D than all but three companies (INTC, MSFT, and AMZN) in all of North America in any sector. Let's look at that visually for a second.
On the x-axis we have equal spaced the companies (rank) and on the y-axis we have plotted R&D.

Click here to interact with this image.
Google got into the operating system fray very late with two mega players (MSFT and AAPL) already in there, but Andoid now boasts 80% of the mobile market. Oddly, that incredible narrative is rarely discussed. However, Google has lost some of its control over the market, as many new players have created their own flavors of Android which are totally out of the control of Google. That brings a new vulnerability which MSFT is taking advantage of in a very clever and flexible way. But, still, let's not lose sight of one of the great technological achievements in the last several years.
At the Google I/O 2015 developer conference that took place just a few weeks ago, the public was exposed to some of Google's developments, particularly surrounding Android. We saw an Android M preview, Android Wear updates, Google Photos (which will be one of the few pieces stripped out of the soon to be dead Google Plus), Android Pay (competitor to Apple Pay), Android fingerprint recognition, Android Auto (self-driving car!), Virtual Reality, Project Tango (a super cool new tablet), Chromecast 2 and of course, though not presented at the conference this year, Google has three Smart Watches. Wondering where the R&D is going? That was your list.
But, while Google makes money in a lot of different ways, web traffic and ads are still at the top with over 4 million searches per minute and 72 hours of YouTube (owned by Google) videos are uploaded. With massive R&D expenditures comes expectations of another large success if not another truly fantastic addition to the vernacular of technology. Revenue has hit a bit of a peak (for now) and operating margin is slipping a little. Earnings and cash from operations growth will be difficult to achieve if revenue doesn’t get back on an upswing. That revenue upswing, in part, relies on the successful capitalization of R&D.![]()
Swing Golden Cross Alert: The short-term 10 day MA is now above the 50 day MA.
GOOGL has a five bull (top rated) technical rating because it's trading above its 10-, 50-and 200- day moving averages and the stock is up on the day.
Here are the consensus estimates for next quarter. Note that last quarter's actual result is included at the far right.
| EARNINGS ESTIMATES | |||||
| Earnings Date | EPS | Revenue (Mean) | Revenue (Median) | Last Quarter (Actual) | |
| 2015-07-16 | $5.45 | $14,346.7 M | $14,326.0 M | $17,258.0 M | Provided by ZACKS |
Let's look at the core elements that drive the company's fundamental rating.
|
|
|
Fundamentals Rating Summary |
|
|
| METRIC | CURRENT | 1YR AGO | 2YR AGO | DIRECTION |
| Revenue (TTM US$ Millions) | 67,839 | 57,988 | 52,481 | RISING |
| Operating Margin (QTR) | 1.347 | 1.36 | 1.33 | FALLING |
| Net Income (TTM US$ Millions) | 14,578 | 13,026 | 11,193 | RISING |
| Levered Free Cash Flow (TTM US$ Millions) | 10,292 | 7,193 | 9,604 | RISING |
| Research and Development (US$ Millions) | 2,753 | 2,126 | 1,847 | RISING |
| Research and Development Expense/Revenue | 0.160 | 0.138 | 0.128 | RISING |

|
|
| Stock Returns and Chart |
|
|
Before we dig into the fundamental trends that drive the rating, let's look at a two-year stock chart with regression channel and 10-day momentum (on the bottom).

Click here to interact with this stock chart
Now let's examine the visualizations of the critical financial measures.

| METRIC | CURRENT | 1YR AGO | 2YR AGO | DIRECTION |
| Revenue (TTM US$ Millions) | 67,839 | 57,988 | 52,481 | RISING |
Revenue over the trailing twelve months (TTM) for GOOGL is rising and is at the second highest level ever. The current $67.8 billion is up from $58 billion a year ago, or a 17% rise. The two-year change in revenue (TTM) is a 29% rise. This is a mega cap with double digit revenue growth. The stock price has been dead. the company is not.
What do all these numbers mean?
GOOGL's fundamental rating benefited these results:
1. The one-year change was positive (but no extra points were given for a large percentage increase).
2. The two-year change was positive.
Let's look at Revenue (TTM US$ Millions) in the chart below.

Click Here to Interact With This Chart
Normally we look at operating margins at this stage, but I'd like to push the story forward and look at earnings.
| METRIC | CURRENT | 1YR AGO | 2YR AGO | DIRECTION |
| Net Income (TTM US$ Millions) | 14,578 | 13,026 | 11,193 | RISING |
Net Income (after tax profit) over the trailing twelve months (TTM) for GOOGL is up nearly 12% year-over-year and is in fact at an all-time high (trailing-twelve-months). Interestingly, two quarters ago the company hit its highest quarterly number ever at over $4.75 billion. last quarter the company reported nearly $3.6 billion, which was its second largest quarterly number ever. Google isn't dead.
In our next chart we plot Net Income (TTM US$ Millions) in the blue bars and the quarterly results in the gold line. Checkout that gold line for the last two quarters relative to the past.

Click Here to Interact With This Chart
| METRIC | CURRENT | 1YR AGO | 2YR AGO | DIRECTION |
| Levered Free Cash Flow (TTM US$ Millions) | 10,292 | 7,193 | 9,604 | RISING |
I say it every time, but it bears repeating, levered free cash flow (FCF) (TTM US$ Millions) is a critical determinant of stock price since market cap is the present value of all future free cash flows. For GOOGL the metric is rising, up a huge 43% tear-over-year. Now that comp is a little misleading, as Google actually hit an all-time high in FCF (TTM) back in September 2012. But, Google is now at its highest level in FCF (TTM) since the year ending Dec 2012, and is at its third highest level ever.
For our next chart we plot Levered Free Cash Flow (TTM US$ Millions) in the blue bars through time.

Click Here to Interact With This Chart
| METRIC | CURRENT | 1YR AGO | 2YR AGO | DIRECTION |
| Research and Development (US$ Millions) | 2,753 | 2,126 | 1,847 | RISING |
R&D is where it's it for Google. We looked at a snapshot in our first visual in the introduction. Now we can look at a time series. Research and Development (US$ Millions) in the most recent quarter for GOOGL was $2.7 billion, up a remarkable 29% year-over-year and 49% over two-years. The bullish thesis for Google must be that all of this R&D will pay off in the future.
R&D per dollar of revenue for the latest quarter is $0.160. Last year this measure was $0.138 (it's also rising).
In our final time series chart we plot Research and Development (US$ Millions) in the blue bars and R&D per dollar of revenue in the orange line.

Click Here to Interact With This Chart
Summary
Google is spending on R&D like almost no other company in the world. It has seen earnings rise to all-time highs, although revenue has been a bit 'toppy.' Estimates for next quarter are substantially lower than the quarter before. We're talking about $3 billion lower. The Google I/O 2015 conference reminded us of the vast reach Google has in all areas technology and the vast array of products it's working on. But, there is a sense that 'what's next" isn't really clear. Google dominates search and with Facebook dominates on-line advertising. OK, but now what?
There is this nagging rumor of Google taking over Twitter. It certainly makes sense as Google's top competitor is now clearly Facebook and Google Plus was a failure. Google could use (some would say needs) a social media presence. It's on the edges of that realm with Google Photos -- a potential competitor to Facebook's Instagram and that combined with Twitter does sound rather tasty.
In an interview on Business News Network I stated that while I think the combination makes a lot of sense, I don't think Google will act until we (and it) know where Twitter is headed. Google has the cash, it can wait to see if Twitter is really making progress at creating a compelling and differentiated advertising platform. If so, Twitter will be more expensive, but worth much more to Google. If not, Twitter will be much less expensive to Google. I think it may be worth Google's wait, but who knows, maybe Google acts fast.
For now the bullish thesis for Google must be this: An expansive rise in research & development along with a suddenly dominating lead in mobile OS must bring about the next evolutionary if not revolutionary change from Google. That change must at the very least expand upon its current core business of advertising and better yet, expand into a new arena, or even go so far as to shake technology at its core. Twitter is an after thought until... it becomes the only thought. And it may happen.