


Custom Pre-earnings Bullish Diagonal Trigger in Costco Wholesale Corporation
Costco Wholesale Corporation (NASDAQ:COST) : Custom Pre-earnings Bullish Diagonal Trigger
Date Published: 2019-08-22
Disclaimer
The results here are provided for general informational purposes from the CMLviz Trade Machine Stock Option Backtester as a convenience to the readers. The materials are not a substitute for obtaining professional advice from a qualified person, firm or corporation.Lede
Just as we adjusted our buy the dip timing to address the new market volatility sparked by a tweet, we too now adjust our pre-earnings diagonal trade.Costco next has earnings due out on 2019-10-03. Thirty-days before then would be 2019-09-03.
Preface
Today we use the new and improved version of the pre-earnings diagonal momentum strategy. This goes beyond just naked long a call, and gives the opportunity for two shots at momentum with one trade.LOGIC
The logic behind the test is easy to understand -- in an any market there can be a stock rise ahead of earnings on optimism, or upward momentum, that sets in before an earnings date. That phenomenon has been well documented by Capital market Laboratories in our seminal webinar on market patterns.Further, if this initial custom diagonal strategy fails due to lack of bullish momentum in the stock, it has a second chance built in without making another trade -- let the short-term leg expire, and keep holding the longer dated leg. Let's see it in action.
The goal is higher win rates than a straight down the middle naked call speculation.
The Bullish Option Trade Before Earnings in Costco Wholesale Corporation
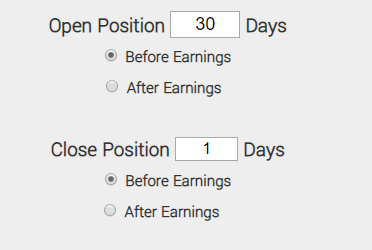
We will examine the outcome of going long an at-the-money (strike price is set to the 50 delta) call option that has 30-days to expiry, and short an out-of-the-money (strike price set to the 30 delta) call option with 21-days to expiry. But we do all this starting 30-days before-earnings with the additional following rules:* Custom Earnings Timing
This call time spread opens 30 calendar days before earnings:
* Use a technical trigger to start the trade, if and only if these specific items are met.
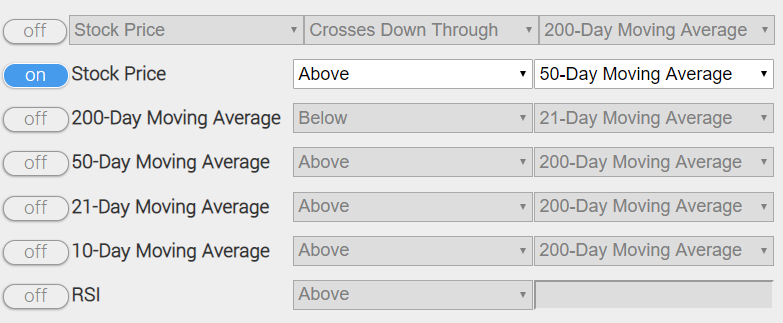
* The stock price is above the 50-day simple moving average:
Here it is in an image from Trade Machine -- only focus on the settings where the filter is turned to "on.":
You can set an alert in Trade Machine®, which will track all of these moving parts for you, and message you when it triggers. In fact, you can do this with a portfolio of stocks for a portfolio of bearish and bearish triggers. Let Trade Machine do the work for you -- there's no need to stare at the screen.
* Finally, here is how the custom strategy looks in Trade Machine:
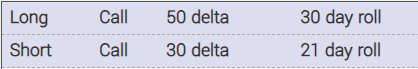
Again, the set-up is opening the at the money call option that is closest to 30-days to expiry (but expires after the earnings date) and selling the out of the money call option that is closest to 21-days to expiry (but expires before the earnings date).
This entire trade closes after the 21-day options expire as it has been backtested. Here is the link to the custom strategy only available to Trade Machine members.
RESULTS
Here are the results over the last three-years in Costco Wholesale Corporation:| COST: Long Diagonal Call Spread | |||
| % Wins: | 87.5% | ||
| Wins: 7 | Losses: 1 | ||
| % Return: | 687.5% | ||
Tap Here to See the Back-test
The mechanics of the TradeMachine® are that it uses end of day prices for every back-test entry and exit (every trigger).
This entire trade closes after the 21-day options expire as it has been backtested. But there is an opportunity, if the trade fails, to hold the longer dated calls right up to the day of earnings and sell it right before, for those that want to take a second swing at the bullish pattern.
Checking the Moving Average
You can check to see if the 50-day MA for COST is above or below the current stock price by using the Pivot Points tab on www.MovingAverages.com.Back-testing More Time Periods in Costco Wholesale Corporation
Now we can look at just the last six-months, which created one trigger:
| COST: Long Diagonal Call Spread | |||
| % Wins: | 100% | ||
| Wins: 1 | Losses: 0 | ||
| % Return: | 29.5% | ||
Tap Here to See the Back-test
And let's look at exactly what happened.
Real Life
The relevant earnings date for COST was May 30th, 2019.On April 30th, the long options opened with an expiry of May 31st. This satisfies the requirement that they are the options closest to 30-days and must expire after earnings.
On that same day, the May 24th options were sold. This satisfies the requirement that it is the options closest to 21-days to expiry, but expire before the earnings event.
Here are all of those words in screenshots:
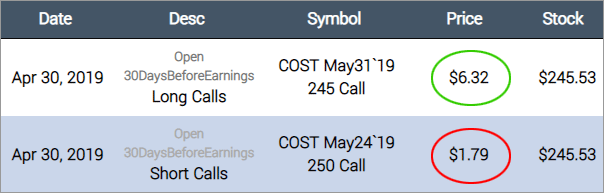
The May 31st 245 call is purchased for $6.32.
The May 24th 250 call is sold at $1.79.
That leaves a strategy with a total cost of $4.53.
On May 24th, both legs are closed:
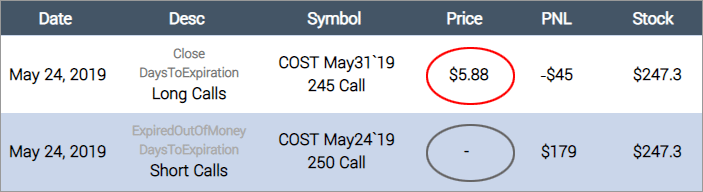
The May 31st 245 call is now sold at $5.88 for a $45 loss.
The May 24th 250 call expires worthless for a gain of $179.
That leaves a strategy with a total sale price of $5.88 versus a cost of 4.53 for a total 29.8% win.
Here is that whole process in one screenshot:
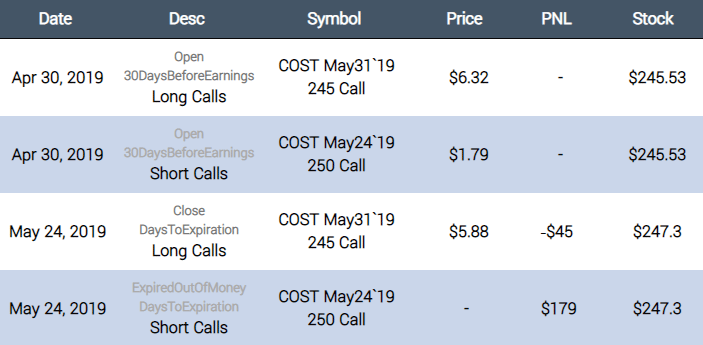
Note that just being long that original call would have been a loser, but using a diagonal spread turned it into a winner.
WHAT HAPPENED
Trade better. Learn about Trade Machine.Risk Disclosure
Past performance is not an indication of future results.
Trading futures and options involves the risk of loss. Please consider carefully whether futures or options are appropriate to your financial situation. Only risk capital should be used when trading futures or options. Investors could lose more than their initial investment.
Past results are not necessarily indicative of future results. The risk of loss in trading can be substantial, carefully consider the inherent risks of such an investment in light of your financial condition.
Please note that the executions and other statistics in this article are hypothetical, and do not reflect the impact, if any, of certain market factors such as liquidity and slippage.
You should read the Characteristics and Risks of Standardized Options.