Symbol not found


Twitter Earnings: An Absolutely Unprecedented Opportunity
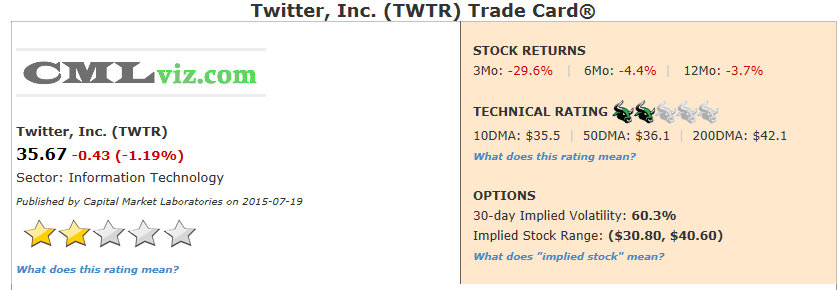
Fundamentals Technicals | Support: 34.36 | Resistance: 36.72 
##Symbol##TWTR
Twitter needs to present a compelling and differentiatied opportunity from Google (GOOGL) and Facebook (FB) to advertsisers for it to break free and become a giant. Real-time advertising content and delivery, combined with Project Lightning seem like that compelling and differentiated opportunity. But that isn't the unprecedented opportunity here. Not by a long shot. This is about probability and something that has never happened for Twitter as a public company.
Earnings are an event -- the implied (expected) volatility for the day of announcement is higher than other days. Twitter's earnings announcement presents a unique, compelling and unprecedented event for the company due to an interesting coincidence of phenomena.
Side one to this phenomenon reads like this: In the last three months Twitter's CEO has been replaced, its long time chief of communications, Gabriel Stricker, resigned, the company missed revenue estimates in an earnings call and took down full your forecasts rather substantially. While the company has announced the very exciting Project Lightening, it's yet to be launched and therefore will only have an impact on forward looking guidance and not on current revenue or earnings. The stock is down 30%. These are the facts, and they are not disputed.
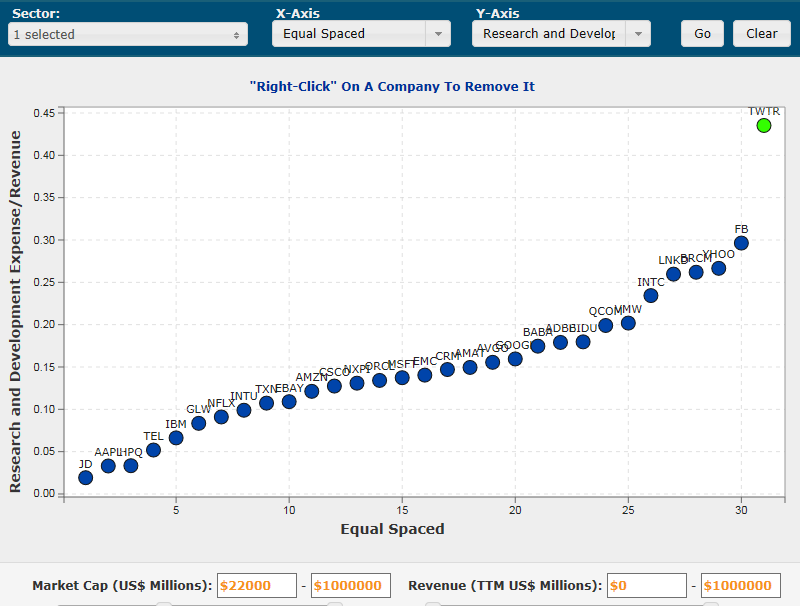
Side two reads to this phenomenon reads like this: There has been some misguided discussion that Twitter is somehow "small." Every minute there are over 277,000 tweets sent. Twitter is enormous, it's just incomparable to Faceboook (which gets 2.5 million shares per minute). It is the second largest and most internationally used social media and may in fact have the greatest impact on the social vernacular than any other company ever. Further, TWTR is growing revenue faster than all but one firm in technology of relevant size (market cap > $22 billion). In the scatter plot below we have included all technology firms with market caps greater than $22 billion. The y-axis is one-year revenue growth (TTM) and the x-axis equal spaces the companies (rank).
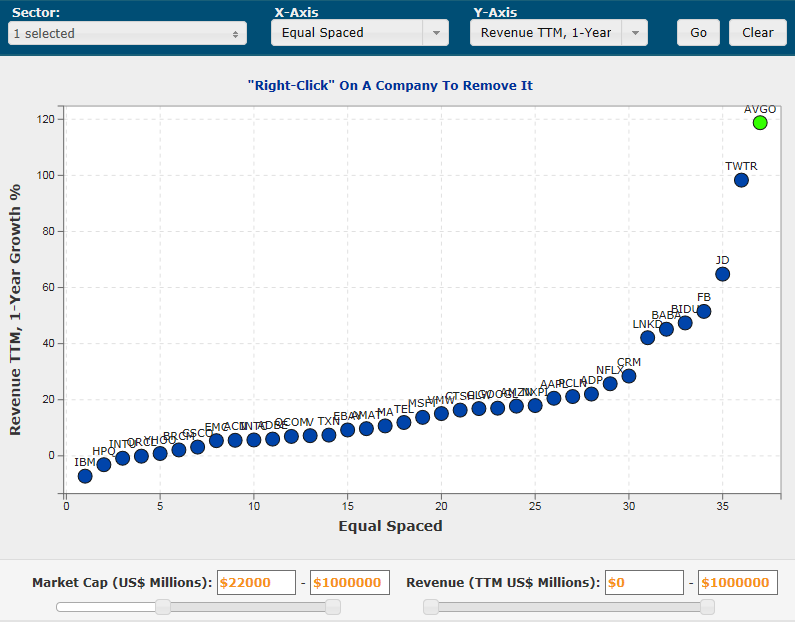
Click Here to Interact With This Image
For completeness, I wrote a seminal piece on the one firm outpacing Twiter, Avago (AVGO) here: Why Avago May Be the Most Compelling Stock in All of Technology.
For Twitter, even with that incredible revenue growth, the firm accounts for less than 1% (.89%) of on-line advertising, which means both that there's room for growth and an urgent need to convey a compelling value proposition to advertisers that's different than Facebook and Google.
Now, simplifying (a lot) the stock market reaction to an earnings release, a stock price can do one of five things:
(1) Go down a lot.
(2) Go down a little but not a lot.
(3) Stay in the same place (ish).
(4) Go up a little but not a lot.
(5) Go up a lot. 
In my opinion, given the top executive exists, a new CEO sitting on the King's throne that has had little time to affect any change, forecasts which have already been taken down under the "prior" regime and the most important product launch yet to happen, Twitter (TWTR) may have fallen upon a mulligan. This may imply that the likelihood of event one (a large stock drop) is much lower than at a normal time (a normal earnings release), and that probability has been sprinkled around the rest of the four options. That means risk is massively in favor of long positions relative to short positions.
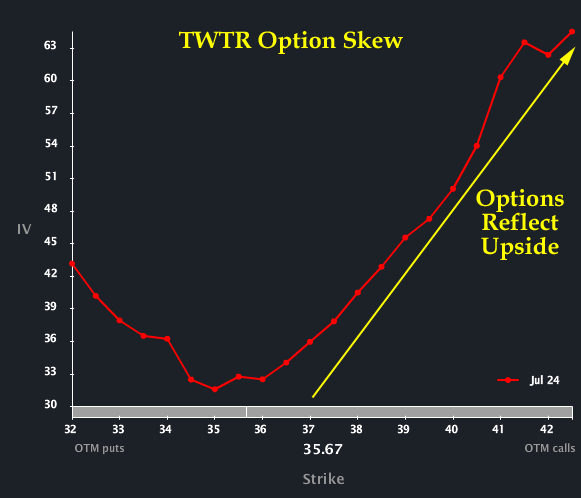
This type of stock price set-up does happen from time-to-time, but never have I seen such a lopsided distribution in a company that is so heavily in its growth phase and so heavily followed in the stock market. If you're wondering if anyone else agrees, it turns out, yes, very much so. The option market shows upside skew in Twitter. If you want to understand that statement you can read Understanding option Skew. What it is and Why it Exists. Here's an image.
This is a remarkable and unprecedented moment in time for Twitter stock and its price discovery. Now, can Twitter stock go down "a lot" off of earnings? Yes, of course it can. It's still a non-zero chance that the firm reports a disastrous quarter and that's why C-level executives are leaving. But, short-term bets (it's not investing to trade on an earnings day) are made with an eye toward favorable probabilities, and never in Twitter's (short) existence as apublic company has an earnings bet had more edge to the upside, simply because the catastrophic downside risk is substantially limited. Like I said, new CEO, other C-level exits, they've got a mulligan.
There's yet more room for a mulligan if Twitter misses earnings again. The company can point to its efforts in research & development (R&D). In fact, if we plot TWTR with every other technology firm above $22 billion in market cap, equal space the companies on the x-axis (rank them) and plot R&D per dollar of revenue on the y-axis, we can see there is no company even close to spending as much as Twitter.
Click Here to Interact With This Image
This has the makings of a totally lopsided risk event, where the downside is muted, the upside is ripe for the picking, and the distribution is not in equilibrium and heavily favors one side.
![]()
TWTR is hitting a technical breakdown right now. The stock has a one bull (lowest rated) technical rating because while it's trading above its 10-day moving average, it's down on e the day, trading below both the 50- and 200-day moving averages and the 10 day MA is below the 50 day MA ("swing death cross").
Here are the consensus estimates for next quarter. Note that last quarter's actual result is included at the far right.
| EARNINGS ESTIMATES | |||||
| Earnings Date | EPS | Revenue (Mean) | Revenue (Median) | Last Quarter (Actual) | |
| 2015-07-28 | $-0.24 | $564 million M | $560 million M | $436 million M | Provided by ZACKS |
Let's look at the core elements that drive the company's fundamental rating.
|
|
|
Fundamentals Rating Summary |
|
|
| METRIC | CURRENT | 1YR AGO | 2YR AGO | DIRECTION |
| Revenue (TTM US$ Millions) | 1,588 | 801 | 377 |  |
| Operating Margin (QTR) | 0.748 | 0.66 | 0.83 | RISING |
| Net Income (TTM US$ Millions) | -608 | -751 | -85 | RISING |
| Levered Free Cash Flow (TTM US$ Millions) | 167 | 194 | FALLING | |
| Research and Development (US$ Millions) | 190 | 149 | 48 | RISING |
| Research and Development Expense/Revenue | 0.435 | 0.596 | 0.416 | FALLING |
|
|
| Stock Returns and Chart |
|
|
Before we dig into the fundamental trends that drive the rating, let's look at a two-year stock chart with regression channel and 10-day momentum (on the bottom).
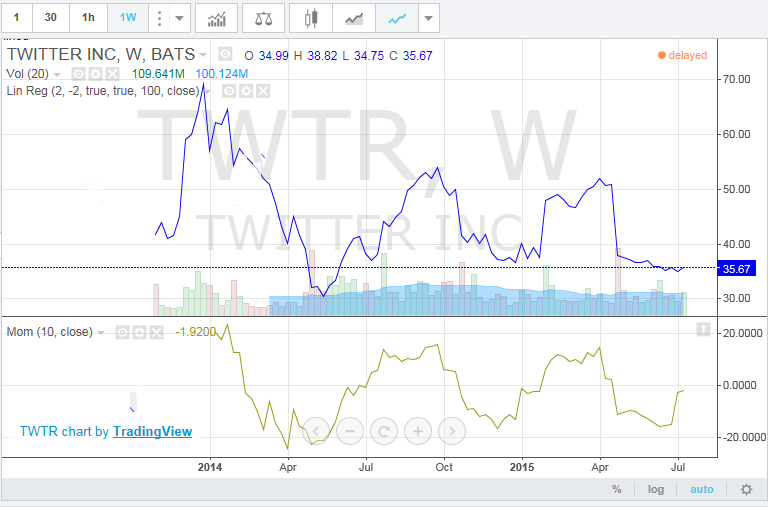
Click here to interact with this stock chart
Now let's examine the visualizations of the critical financial measures.

| METRIC | CURRENT | 1YR AGO | 2YR AGO | DIRECTION |
| Revenue (TTM US$ Millions) | 1,588 | 801 | 377 | |
Revenue (TTM) has increased for at least five consecutive quarters which triggers a "trend" (in this case it's nine consecutive quarters -- or every quarter the copmany has been public). Twitter revenue (TTM) is up 98% and when a company grows that fast, we must recognize the added importance of top-line growth, perhaps even above and beyond earnings, free cash flow and margins. Regardless of the low 2 fundamental (star) rating, if revenues continue to explode, everything could follow suit for TWTR. But even if they don't, this last quarter's lack of growth (if that happens) will have some forgiveness.
What do all these numbers mean?
TWTR's fundamental rating benefited these results:
1. The one-year change was positive.
2. The one-year change was greater than +20% (an extra boost to the rating).
3. The two-year change was positive.
Finally, the five+ consecutive quarters of an upward trend in revenue benefited the fundamental (star) rating.
Let's look at Revenue (TTM US$ Millions) in the chart below.
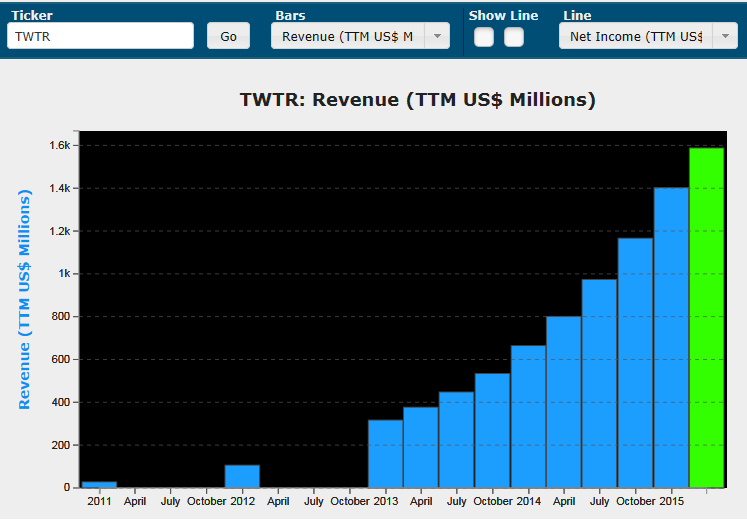
Click Here to Interact With This Chart
| METRIC | CURRENT | 1YR AGO | 2YR AGO | DIRECTION |
| Net Income (TTM US$ Millions) | -608 | -751 | -85 | RISING |
Net Income (after tax profit) over the trailing twelve months (TTM) for TWTR is rising although it's substantially negative. For the most recent trailing-twelve-months (TTM) the company reported net income of -$608 (million). In reality, earnings don't matter right now (yeah, I said it), what we are looking for is revenue growth, revenue forecasts, MAUs (monthly actuve users). A little guidance on periscope and Project Lightning, and that's the earnings report, not net income.
In our next chart we plot Net Income (TTM US$ Millions) in the blue bars and the quarterly results in the gold line. Note the rising bars from a year ago (four quarters ago).
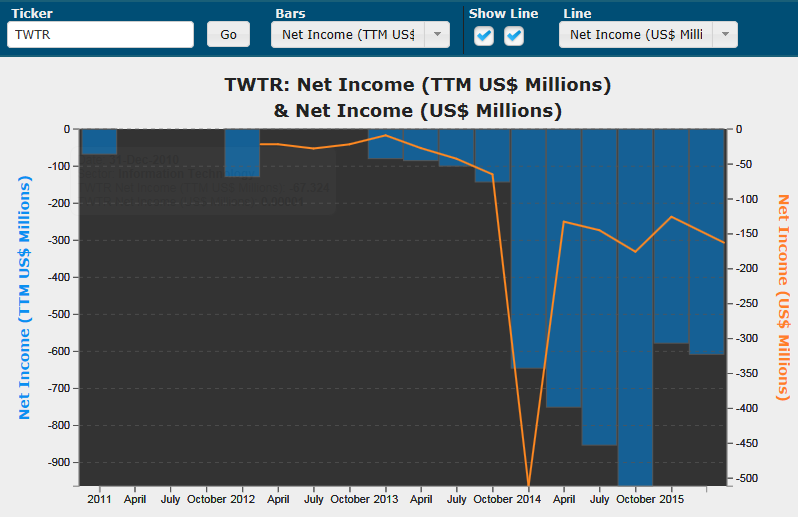
Click Here to Interact With This Chart
| METRIC | CURRENT | 1YR AGO | 2YR AGO | DIRECTION |
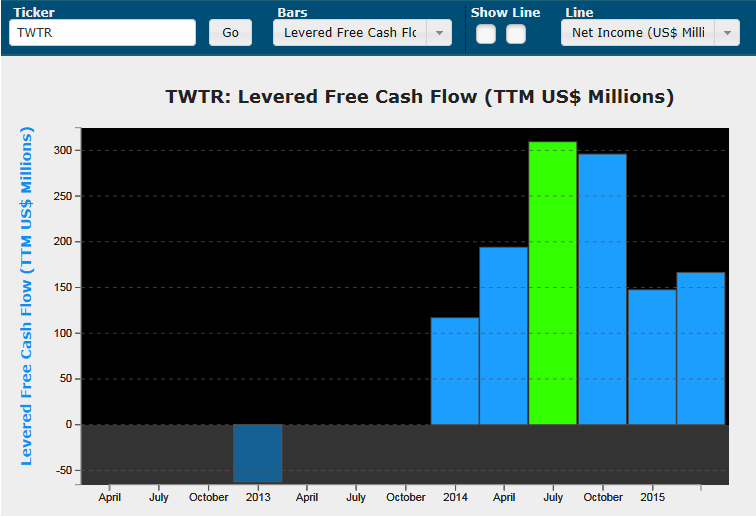
| Levered Free Cash Flow (TTM US$ Millions) | 167 | 194 | FALLING |
Levered Free Cash Flow (FCF) (TTM US$ Millions) is a critical determinant of stock price since market cap is the present value of all future free cash flows. For TWTR the metric is falling (it was $194 million last year) but I do note that FCF is positive. Read that one again... Twitter levered free cash flow is positive. The company has seen a rather dramatic drop its highs of over $300 million, though.
For our next chart we plot Levered Free Cash Flow (TTM US$ Millions) in the blue bars through time. Note the falling bars from a year ago (four quarters ago).
Click Here to Interact With This Chart

| METRIC | CURRENT | 1YR AGO | 2YR AGO | DIRECTION |
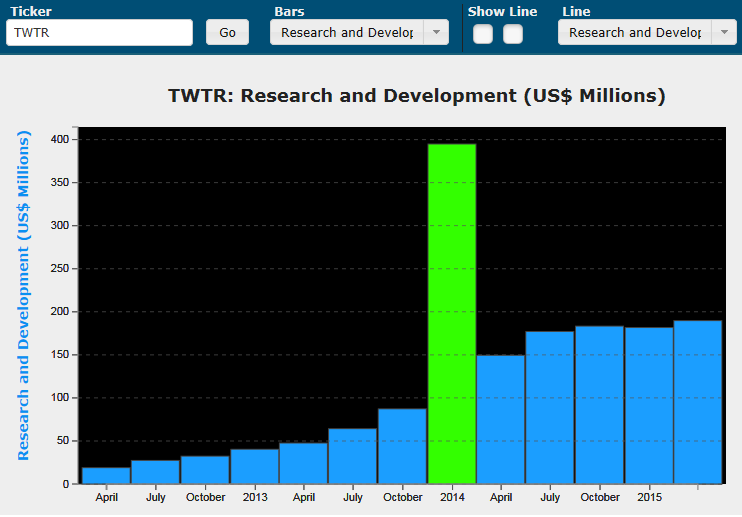
| Research and Development (US$ Millions) | 190 | 149 | 48 | RISING |
Research and Development (US$ Millions) in the most recent quarter for TWTR was $190 millionemarkable 27% year-over-year and up nearly 300% from two-years ago. I do note the nasty tendency of tech firms to include stock based compensation in the R&D category for some unexplained reason, so this number is a bity messy.
In our final time series chart we plot Research and Development (US$ Millions) in the blue bars. Note the rising bars from one-year ago.
Click Here to Interact With This Chart
Summary
With the entrance of a new CEO and the exit of other C-level executives, a lowered full year forecast for revenue and a stock that has been hammered since the last earnings report, the expectations for Tiwtter's performance for the last three months are quite low. Further, anything below expectations with a rosy outlook and sort of wrapped around general explanation of "new leadership is ready to make things better," gives the firm one of the all-time best mulligans for an earnings miss. But, if the company beats estimates, my goodness the upside could absolutely rip. That's an "if."
It is possible Twitter misses earnings badly and gets taken down further and rather substantially so, but the option market and I agree that the upside is more likely, or at the very least, the really ugly downside is quite unlikely. That changes the odds on this earnings bet in a way that, for Twitter, is totally unprecedented.