Jazz Pharmaceuticals plc


Why Jazz Pharmaceuticals Is Winning
Fundamentals Technicals | Support: 173.96 | Resistance: 182.81 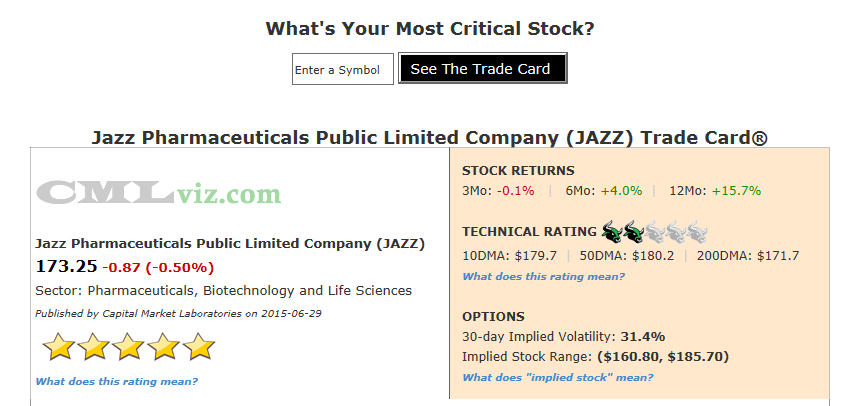
##***Biotech
JAZZ has 2 products in Phase II trials and 3 products in the Phase III trials.
Jazz Pharmaceuticals is one of the mid-cap bio/pharmas showing great strength in its fundamentals due to growth in existing products and a healthy pipeline of new potential products. The company has seen spending increase in both R&D expense(discussed later) and selling, general & administrative (SG&A) expense due to expansion of the company's business which have resulted in larger headcounts and marketing and promotional and professional services expenses.
Revenue (TTM) has risen for more than five consecutive quarters which triggers a "trend". We'll see a revenue increase of over 80% in the last two-years along with earnings, operating margin, free cash flow and R&D growth. Further, we'll also see that the firm generates more revenue per employee than all but one peer. Revenue by product from the last earnings report looks like this:
Xyrem (Narcolepsy treatment) generated $212.7 million in revenue while the number of patients on the drug increased nearly 9% year-over-year. JAZZ is expanding upon it's crown jewel with "REMS" in the next couple of months. REMS is a risk evaluation and mitigation strategy which has received FDA approval as of February of 2015. Erwinaze, an oncology treatment, generated over $50 million in revenue last quarter (a 7% rise year-over-year). Defitelio, which treats a severe hepatic veno-occlusive disease, showed a revenue rise of 15% to over $17 million. This treatment came to JAZZ through the acquisition of Gentium.
The average estimate for next quarter's revenue of $336.2 million is well above last quarter's $309.3 million.
![]()
JAZZ has a two bull (low rated) technical rating because it's trading below both its 10-day (short-term) and its 50-day (medium-term) moving averages. We do note that the stock is trading above the long-term 200-day moving average.
Here are the consensus estimates for next quarter. Note that last quarter's actual result is included at the far right.
| EARNINGS ESTIMATES | |||||
| Earnings Date | EPS | Revenue (Mean) | Revenue (Median) | Last Quarter (Actual) | |
| 2015-08-04 | $2.16 | $336.2 M | $335.8 M | $309.3 M | Provided by ZACKS |
Let's look at the core elements that drive the company's fundamental rating.
|
|
|
Fundamentals Rating Summary |
|
|
| METRIC | CURRENT | 1YR AGO | 2YR AGO | DIRECTION |
| Revenue (TTM US$ Millions) | 1,235 | 923 | 680 |  |
| Operating Margin (QTR) | 1.612 | 1.54 | 1.68 | RISING |
| Net Income (TTM US$ Millions) | 222 | 80 | 304 | RISING |
| Levered Free Cash Flow (TTM US$ Millions) | 290 | 172 | 229 | RISING |
| Research and Development (US$ Millions) | 27 | 18 | 7 | |
| Research and Development Expense/Revenue | 0.087 | 0.073 | 0.034 | RISING |

|
|
| Stock Returns and Chart |
|
|
Before we dig into the fundamental trends that drive the rating, let's look at a two-year stock chart with regression channel and 10-day momentum (on the bottom).
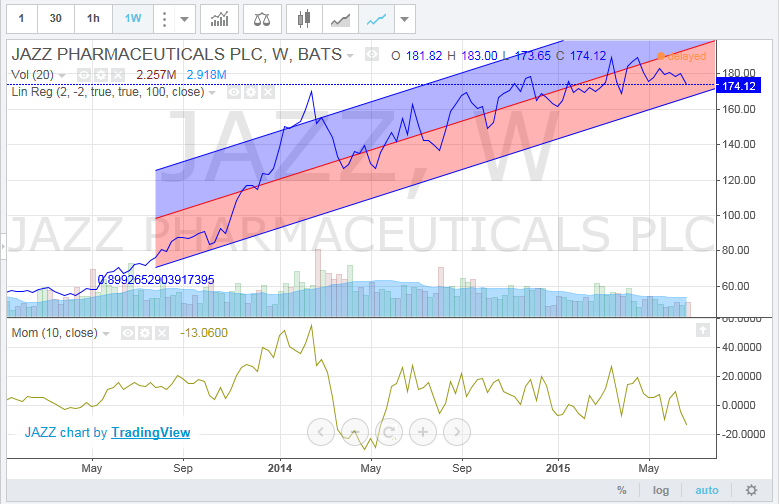
Click here to interact with this stock chart
Now let's examine the visualizations of the critical financial measures.

| METRIC | CURRENT | 1YR AGO | 2YR AGO | DIRECTION |
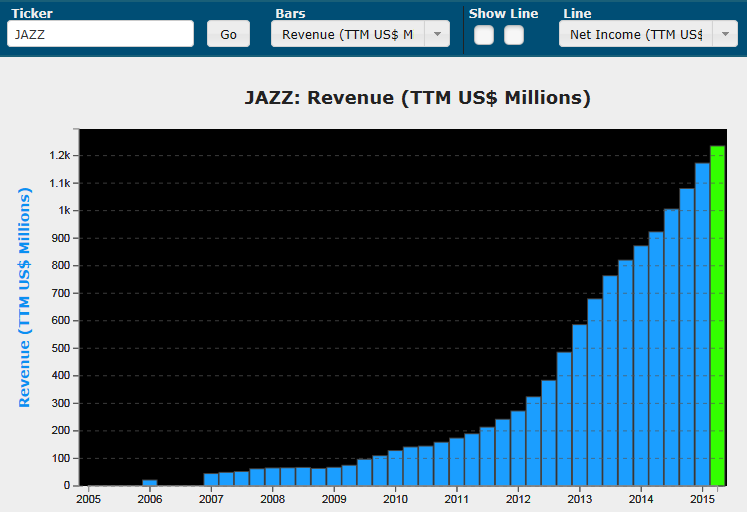
| Revenue (TTM US$ Millions) | 1,235 | 923 | 680 | |
Revenue (TTM) is trending higher meaning that it has increased for at least five consecutive quarters (in this case 20 consecutive quarters) and each time it has broken a new all-time high. Revenue grew 34% year-over-year. Any number over 20% has an added impact on the fundamental (star) rating. The company has seen 80%+ growth in revenue over two-years and now stands at over $1.2 billion. We can definitely welcome JAZZ to the "big-time."
What do all these numbers mean?
JAZZ's fundamental rating benefited these results:
1. The one-year change was positive.
2. The one-year change was greater than +20% (an extra boost to the rating).
3. The two-year change was positive.
Finally, the up-trend (consecutive quarters) in revenue benefited the fundamental (star) rating.
Let's look at Revenue (TTM US$ Millions) in the chart below.
Click Here to Interact With This Chart
Before we move onto net income, free cash flow and R&D, let's look at JAZZ's revenue per employee (y-axis) vs all bio/pharmas with market caps in between $5 billion and $20 billion.
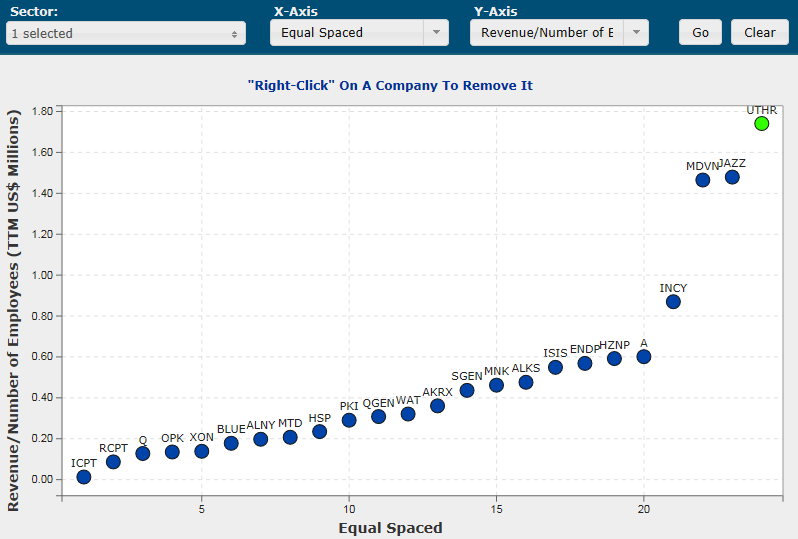
Click Here to Interact With This Chart
We can see JAZZ's remarkable efficiency, generating more revenue per employee ($1.48 million) than all but one peer. This company is doing a lot right.
| METRIC | CURRENT | 1YR AGO | 2YR AGO | DIRECTION |
| Net Income (TTM US$ Millions) | 222 | 80 | 304 | RISING |
Net Income (after tax profit) over the trailing twelve months (TTM) for JAZZ is up 176% from a year ago. While the firm is off of its all-time highs in net income, it has broken out of its dip and is now showing strong earnings growth. The extra costs associated with expansion do hit the bottom line, but let's make no mistake, the firm is turning a profit.
In our next chart we plot Net Income (TTM US$ Millions) in the blue bars and the quarterly results in the gold line.
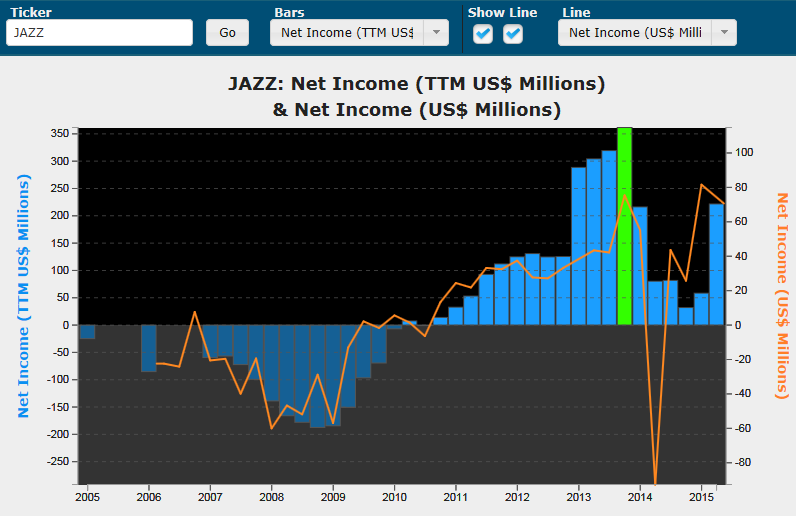
Click Here to Interact With This Chart
| METRIC | CURRENT | 1YR AGO | 2YR AGO | DIRECTION |
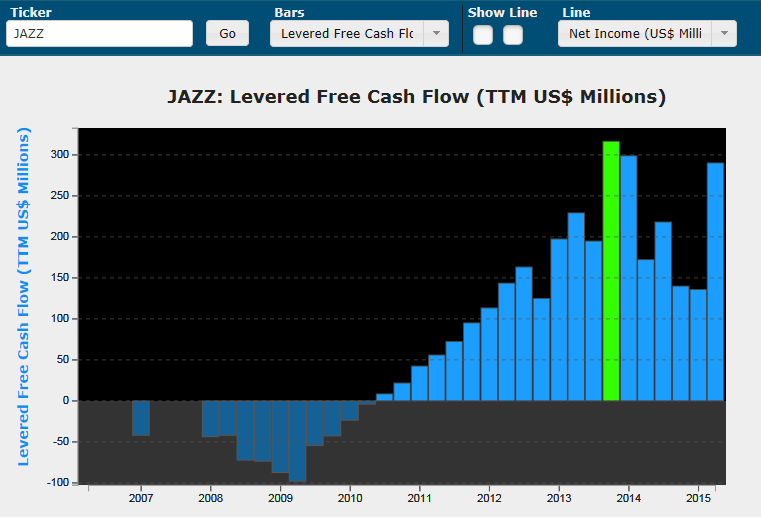
| Levered Free Cash Flow (TTM US$ Millions) | 290 | 172 | 229 | RISING |
Levered Free Cash Flow (TTM US$ Millions) is a critical determinant of stock price since market cap is the present value of all future free cash flows. For JAZZ the metric is up 68% year-over-year and now stands at its highest level since the year ending Dec 31, 2013. Much like net income, there was a bit of a dip, but the number has stayed positive and is now growing.
For our next chart we plot Levered Free Cash Flow (TTM US$ Millions) in the blue bars through time.
Click Here to Interact With This Chart
| METRIC | CURRENT | 1YR AGO | 2YR AGO | DIRECTION |
| Research and Development (US$ Millions) | 27 | 18 | 7 | |
Research and Development (R&D) (US$ Millions) is trending higher meaning that for at least five consecutive quarters, it's been rising (eight quarter sin this case). The company has a strong pipeline, is developing products off of existing lines as well as pushing several products through Phase II and Phase III FDA trials. It has a rich future ahead of it based both on its current product offerings and its future offerings. R&D is up nearly 48% year-over-year and 297% from two-years ago.
While R&D is expanding rapidly, we can see in the chart below (the orange line) that R&D per dollar of revenue is pretty steady.
In our final time series chart we plot Research and Development (US$ Millions) in the blue bars (and R&D per dollar of revenue in the orange line).
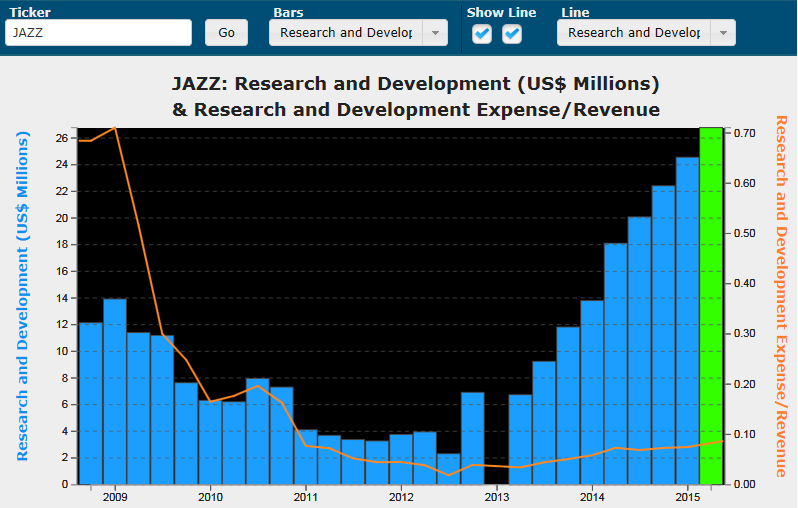
Click Here to Interact With This Chart
Summary
In the world of some dominant mega cap biotechs which are truly making groundbreaking changes to lives, JAZZ has stepped into the fray as a growing company with a healthy pipeline, ripping revenue, growing earnings, free cash flow and R&D and a stock price up 150% in the last two-years. It is one of the most compelling mid-cap bio/pharma companies, and although risk lies ahead with any firm that relies on FDA trials and approvals, JAZZ has moved nicely into the realm of the legitimatly profitable and growing bio/pharma space.