


Bullish Trigger in the Midst of a Technical Meltdown in Okta
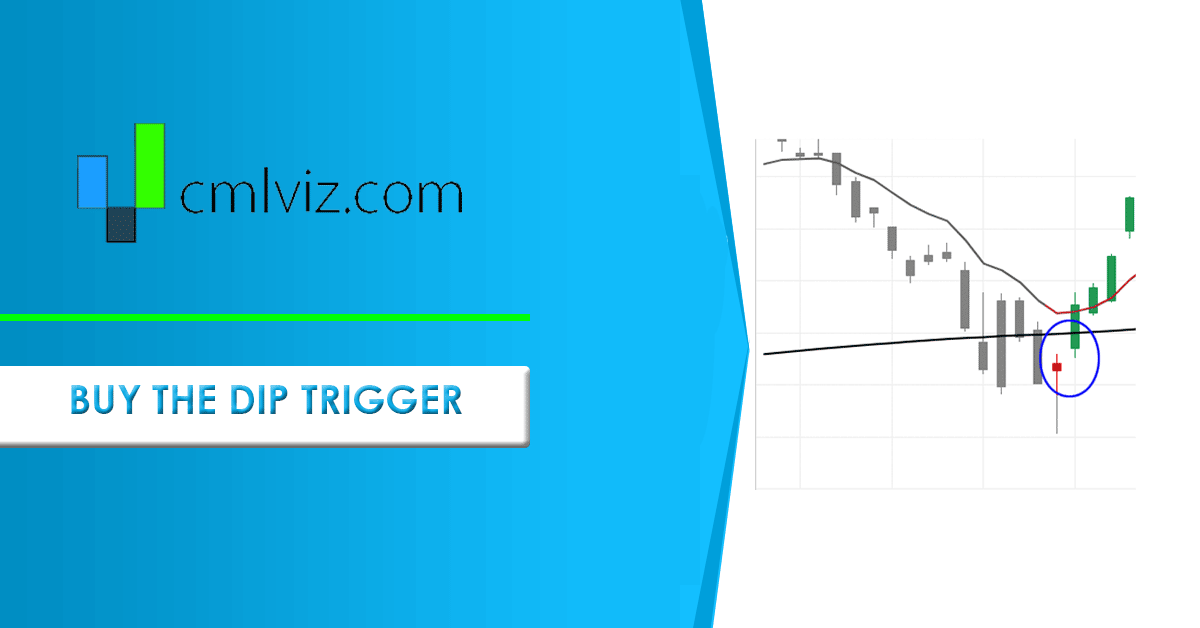
Okta (NASDAQ:OKTA) : Technical Bullish Momentum Trigger
Date Published: 2019-09-09
Disclaimer
The results here are provided for general informational purposes from the CMLviz Trade Machine Stock Option Backtester as a convenience to the readers. The materials are not a substitute for obtaining professional advice from a qualified person, firm or corporation.Lede
Software stocks are in an overdue correction and many of these fantastic companies have rarely, if ever, seen their 200-day moving averages breached.Today we look at one high flier, with a bright future, that in its short history has only gone below its 200-day SMA twice, and each time it poked back above that marker, it has shown a burst of bullishness that has made the short-term option trader a nice win.
Here is a pivot point chart for Okta (NASDAQ:OKTA):
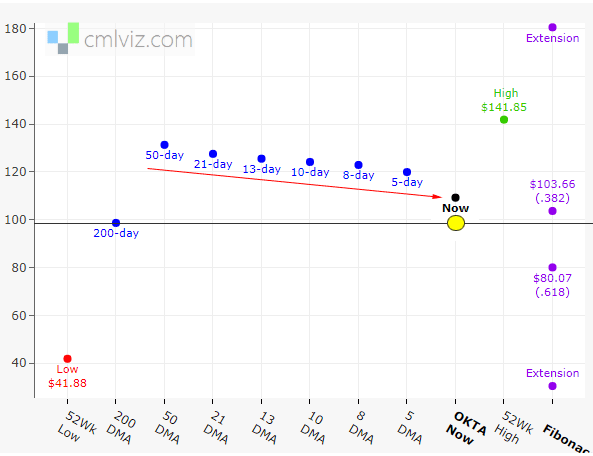
We can see the moving averages are stacked downward and the last support is that 200-day SMA. Now, let's look at a rare pattern.
The Bullish Option Trade with Technical Analysis and Moving Averages in Okta (NASDAQ:OKTA)
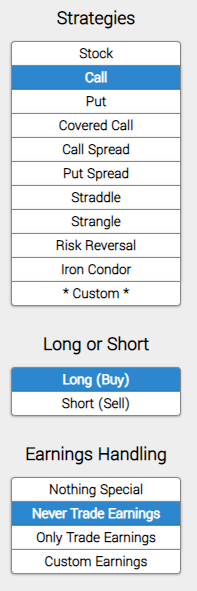
We will examine the outcome of going long an out-of-the-money (strike price is set to the 40 delta) call option, in options that are the closest to 30-days from expiration (using calendar days). But we follow three rules:* Never Trade Earnings
Let's not worry about earnings. Here it is, first, we enter the long call.
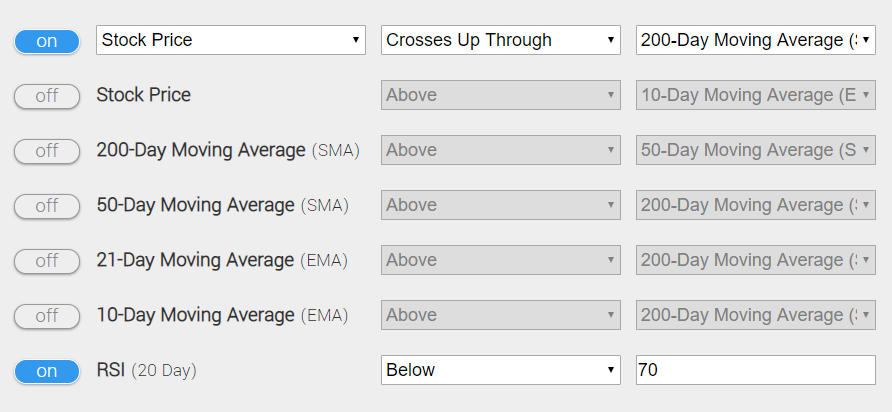
* Use a technical trigger to start the trade, if and only if these specific items are met.
* The day that the stock crosses above the 200-day simple moving average (SMA) means that the stock has had downward momentum and is breaking back out of technical failure.
* RSI (using 20-days) is below 70, so the stock isn't over bought.
Here it is in an image from Trade Machine -- only focus on the settings where the filter is turned to "on.":
You can set an alert in Trade Machine®, which will track all of these moving parts for you, and message you when it triggers. In fact, you can do this with a portfolio of stocks for a portfolio of bearish and bearish triggers. Let Trade Machine do the work for you -- there's no need to stare at the screen.
* Finally, we set a stop and limit:
* Use a 50% limit and a 50% stop.
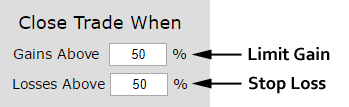
At the end of each day, the back-tester checks to see if the long call is up or down 50%. If it is, it closes the position.
OPTION BACKTESTER RESULTS - TECHNICAL ANALYSIS
Here are the results over the last three-years in Okta, which all come from the last year:| OKTA: Long 40 Delta Call | |||
| % Wins: | 100% | ||
| Wins: 2 | Losses: 0 | ||
| % Return: | 101% | ||
Tap Here to See the Back-test
The mechanics of the TradeMachine® are that it uses end of day prices for every back-test entry and exit (every trigger).
Setting Expectations
While this strategy had an overall return of 101%, the trade details keep us in bounds with expectations:➡ The average percent return per trade was 67% for each 30-day period.
Checking MovingAverages.com
You can check to see the values of all the moving averages discussed above with real-time daily prices, including live after hours prices, for OKTA by viewing the Pivot Points tab on MovingAverages.com -- that's easy enough to remember.Next Steps
Apply your skills beyond drawing lines on one chart at a time -- tap here to use pattern recognition. You can do this.Risk Disclosure
Past performance is not an indication of future results.
Trading futures and options involves the risk of loss. Please consider carefully whether futures or options are appropriate to your financial situation. Only risk capital should be used when trading futures or options. Investors could lose more than their initial investment.
Past results are not necessarily indicative of future results. The risk of loss in trading can be substantial, carefully consider the inherent risks of such an investment in light of your financial condition.
Please note that the executions and other statistics in this article are hypothetical, and do not reflect the impact, if any, of certain market factors such as liquidity and slippage.
You should read the Characteristics and Risks of Standardized Options.