Booking Holdings Inc
:PCLN 1:19:32 PM EDT
3,433.57
+3.43
(+0.10%)


Why Priceline's Greatness May Point to a Market Correction

##Symbol##PCLN
|
The Priceline Group Inc. (PCLN)
1163.57 -12.63 (-1.07%) Sector: Information Technology Published by Capital Market Laboratories on 2015-06-17  What does the rating mean? |
3-Month Stock Move: +0.4% 6-Month Stock Move: +11.3% 12-Month Stock Move: -3.2% _________ 30-day Option Implied Volatility: 19.7% Implied Stock Range: ($1,111.30, $1,215.90) What does "implied stock" mean? |
I'm going to show you why Priceline is an incredible company. Then we'll both be left questioning, "if it's so great, why is the stock down in the last year?" The final image will answer that question unambiguously. But for now, let us journey together so we can finally really understand why everyone is making valuation calls on the entire market.
Here's the first part (the greatness of PCLN). PCLN owns the on-line travel space with a ton of competitors at its heels. The company's revenue (TTM) has broken an all-time high for each of the last 30 quarters (that's more than seven-years). The company has essentially done the same thing with earnings (TTM) over the last 15 consecutive quarters. All the while, the firm is dedicated to being flexible, adapting and, when the need arises, to being acquisitive.
The company is investing in properties in Africa, which is growing at breakneck speed. It took a $500 million piece of Ctrip (China's largest travel website) and acquired restaurant-reservation service OpenTable for $2.6 billion in June of 2014. PCLN has been open about the possibility of raising its stake in Ctrip to 15% (up from the current 11%). Price line has also acquired Rocket Travel ($20 million), PriceMatch, Buuteeq and Kayak (in 2013 for $1.7 billion).
Obviously the acquisitive nature of the company makes the a revenue time series a little "messy," but the bottom line (no pun intended) is that the firm continues to turn those acquisitions into not only revenue, but profit.
Here are the consensus estimates for next quarter. Note that last quarter's actual result is included at the far right.
| EARNINGS ESTIMATES | |||||
| Earnings Date | EPS | Revenue (Mean) | Revenue (Median) | Last Quarter (Actual) | |
| 2015-08-10 | $11.29 | $2,270.0 M | $2,267.7 M | $1,840.7 M | Provided by ZACKS |
Let's look at the core elements that drive PCLN's fundamental rating. They are astounding.
|
|
|
Fundamentals Rating Summary |
|
|
| METRIC | CURRENT | 1YR AGO | 2YR AGO | DIRECTION |
| Revenue (TTM US$ Millions) | 8,641 | 7,133 | 5,526 |  |
| Operating Margin (QTR) | 1.293 | 1.36 | 1.34 | FALLING |
| Net Income (TTM US$ Millions) | 2,424 | 1,980 | 1,482 | |
| Levered Free Cash Flow (TTM US$ Millions) | 2,400 | 1,765 | 1,347 | RISING |
| Capital Expenditures (TTM US$ Millions) | 133 | 99 | 57 | |

|
|
| Stock Returns and Chart |
|
|
Before we dig into the fundamental trends that drive the rating, let's look at a stock chart with regression channel and 10-day momentum (on the bottom).

Click here to interact with this stock chart
Now let's examine the visualizations of the critical financial measures.

| METRIC | CURRENT | 1YR AGO | 2YR AGO | DIRECTION |
| Revenue (TTM US$ Millions) | 8,641 | 7,133 | 5,526 | |
This is all going to be goodness, so let's just get into it. Revenue (TTM) has increased for 30 consecutive quarters which triggers a "trend." In the time series chart below, we can see the consecutive quarter growth.
Note that PCLN is growing revenue by 21.14% year-over-year. Any number over 20% has an added impact on the fundamental (star) rating.
And yes, a part of revenue growth is acquisition.
What do all these numbers mean?
PCLN's fundamental rating benefited these results:
1. The one-year change was positive.
2. The one-year change was greater than +20% (an extra boost to the rating).
3. The two-year change was positive.
Finally, the five+ consecutive quarters of an upward trend in revenue benefited the fundamental (star) rating.
Let's look at Revenue (TTM US$ Millions) in the chart below.

Click Here to Interact With This Chart
| METRIC | CURRENT | 1YR AGO | 2YR AGO | DIRECTION |
| Operating Revenues/Operating Expense | 1.293 | 1.36 | 1.34 | FALLING |
This ratio (which simply represents how much revenue is generated per one dollar of expense) must be at a minimum above 1.0 in order for a company to turn an operating profit. For the latest quarter PCLN showed a ratio of 1.29. BUT, that ratio is cyclical for PCLN.
If we look at the chart below, we can see the peaks for quarters ending Sep. 30th, every year. At those peak times, the company has realized an operating margin of 1.87. In English, PCLN generates $1.87 in revenue for every one dollar it spends in expense. That's HUGE. The year-over-year number is lower, but these are phenomenal numbers.
What do all these numbers mean?
A year ago Operating Revenues/Operating Expense was 1.36. In the last year we can see operating margins are decreasing but are greater than 1.0 for the most recent period.
PCLN's fundamental rating was affected from the operating margin numbers in two ways:
1. The current value is above 1.0 (the firm generates an operating profit).
2. The one-year change was negative (lowers the rating a little bit).
Let's look at Operating Revenues/Operating Expense in the chart below with the total assets in the orange line.

Click Here to Interact With This Chart
| METRIC | CURRENT | 1YR AGO | 2YR AGO | DIRECTION |
| Net Income (TTM US$ Millions) | 2,424 | 1,980 | 1,482 | |
The hits keep on coming with earnings. Net Income (after tax profit) over the trailing twelve months (TTM) for PCLN has hit a new all-time high every quarter for the last four-years, including a 22.4% rise year-over-year. This is huge, because while acquisitions can positively impact the top line (revenue), they often times hurt the bottom line. That's simply note the case for PCLN.
In our next chart we plot Net Income (TTM US$ Millions) in the blue bars and the quarterly results in the gold line.

Click Here to Interact With This Chart
| METRIC | CURRENT | 1YR AGO | 2YR AGO | DIRECTION |
| Levered Free Cash Flow (TTM US$ Millions) | 2,400 | 1,765 | 1,347 | RISING |
Levered Free Cash Flow (TTM US$ Millions) is a critical determinant of stock price since market cap is the present value of all future free cash flows. For PCLN the metric is rising. For the most recent trailing-twelve-months the company reported Levered FCF of $2.4 billion, that's an insane 36.0% gain year-over-year. Again, acquisitons often times hurt these numbers, in particular with restructurings and the ever opaque "integration costs."
For our next chart we plot Levered Free Cash Flow (TTM US$ Millions) in the blue bars through time.

Click Here to Interact With This Chart
| METRIC | CURRENT | 1YR AGO | 2YR AGO | DIRECTION |
| Capital Expenditures (TTM US$ Millions) | 133 | 99 | 57 | |
Capital Expenditures (CapEx) (TTM US$ Millions) are also trending higher having set new all-time highs for ten consecutive quarters. CapEx is up 34% year-over-year and up 135.4% from two-years ago. While expanding CapEx can be a dangerous trend, when its coupled with rising net income and FCF, it's all good news.
In our final time series chart we plot Capital Expenditures (TTM US$ Millions) in the blue bars.

Click Here to Interact With This Chart
Summary
So there we have it. PCLN remains the giant in the Internet travel space. It has organic growth. It has growth through acquisition It's growing internally in both Africa and China. Revenue, net income, free cash flow and CapEx are each at all-time highs as this large cap firm continues to grow at the pace of small cap.
The risk as always with this kind of growth is sustainability. The law of large numbers does come into play at some point and we do see that with a stock price that is basically unchanged in the last year. Fundamentally speaking, PCLN looks very strong.
So what's up with the stock?
Friends, we are in an aging bull market with massive amounts of companies hitting new all-time highs in revenue (and earnings). Growth is priced into this market. In order for a company's stock price to rise, it must exceed expectations. In this post script chart, we look at PCLN's Price to Earnings through time.
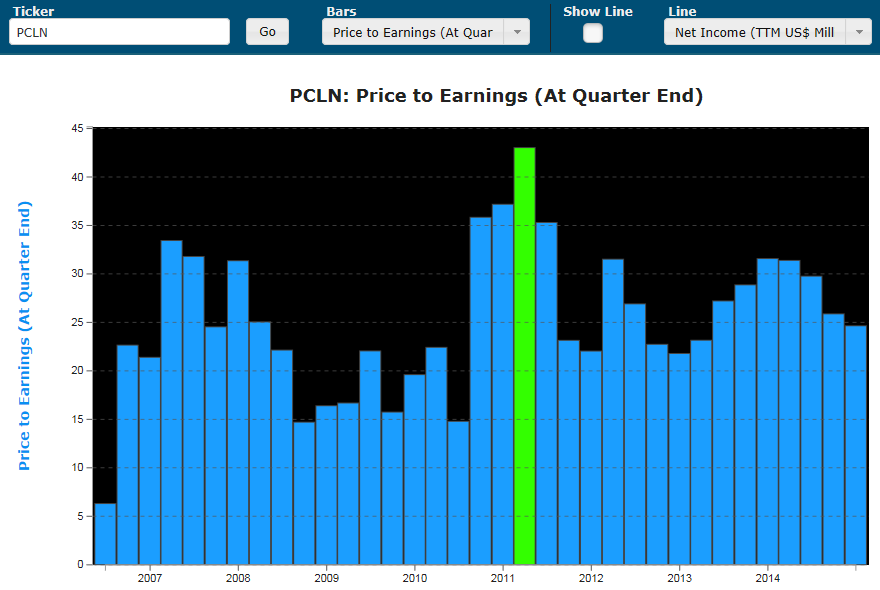
Click Here to Interact With This Chart
PCLN is now trading exactly at a P/E of 25, which is exactly where it traded in Sep. of 2007 (the heat of the last economic boom / bubble). After the bubble burst, PCLN traded at a P/E of 14 (ish). PCLN is an ideal example of a company that is absolutely killing it, but its stock price is simply priced beyond perfection. That's why it hasn't moved up. And less myopically, that's why everyone is starting to make valuation calls on the entire market.